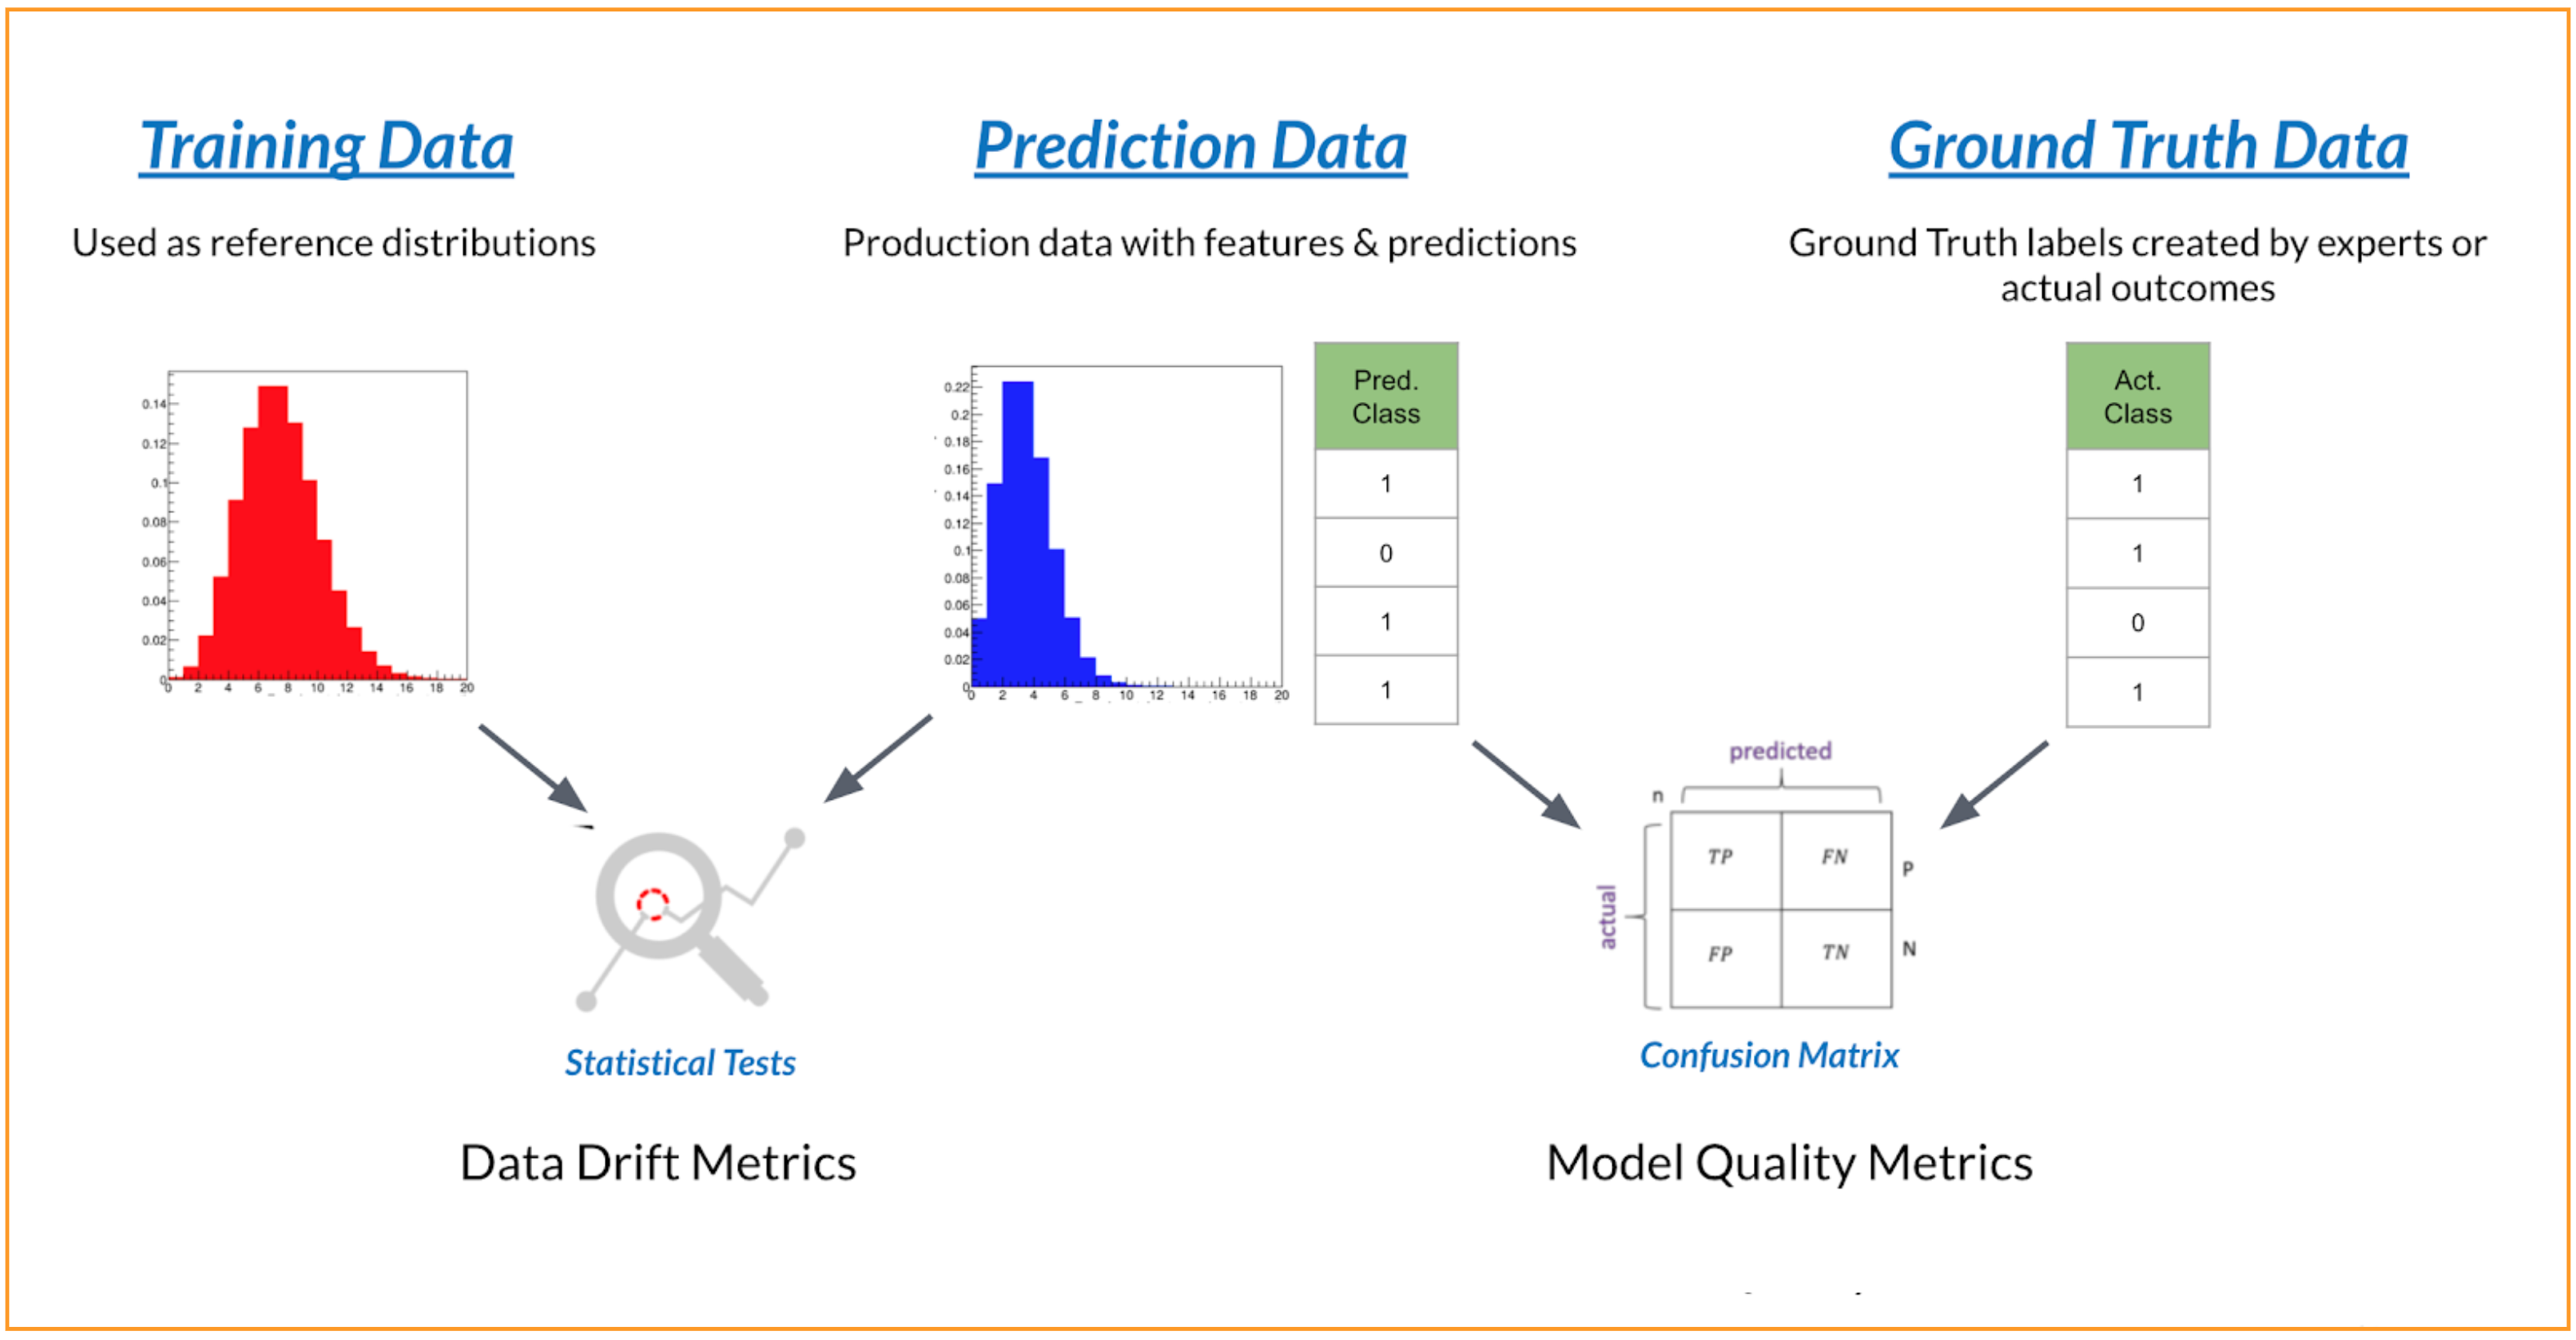
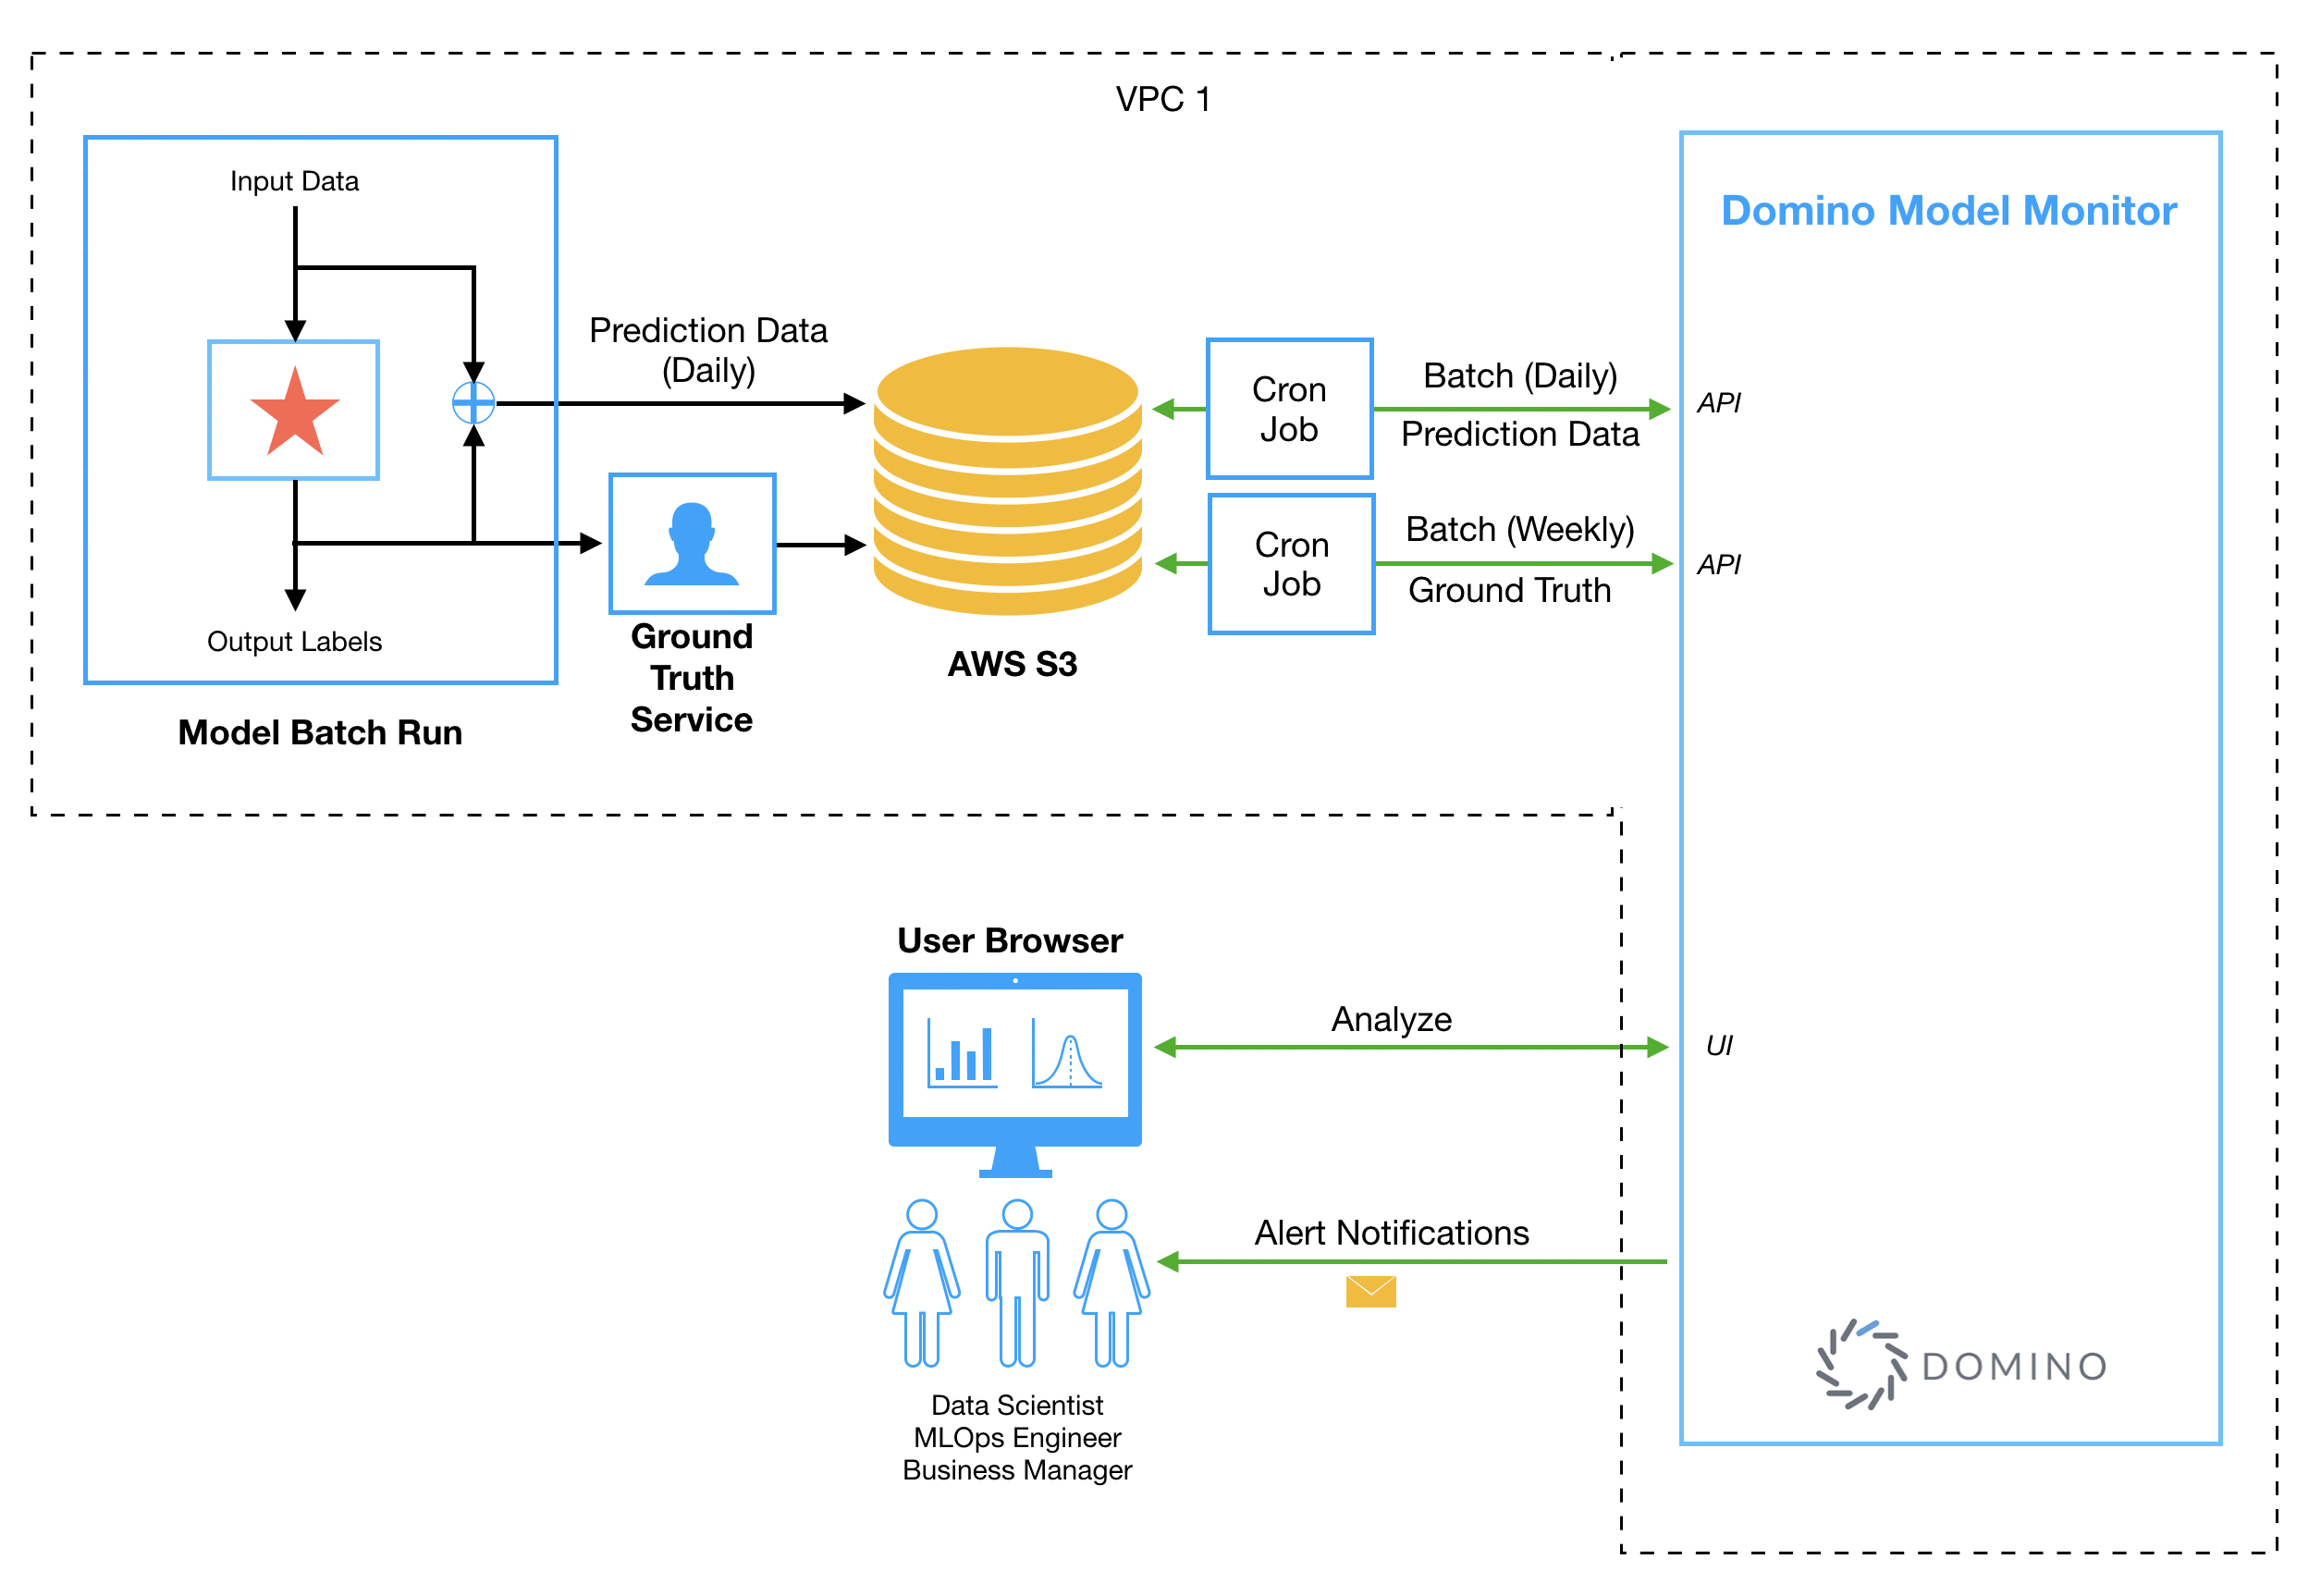
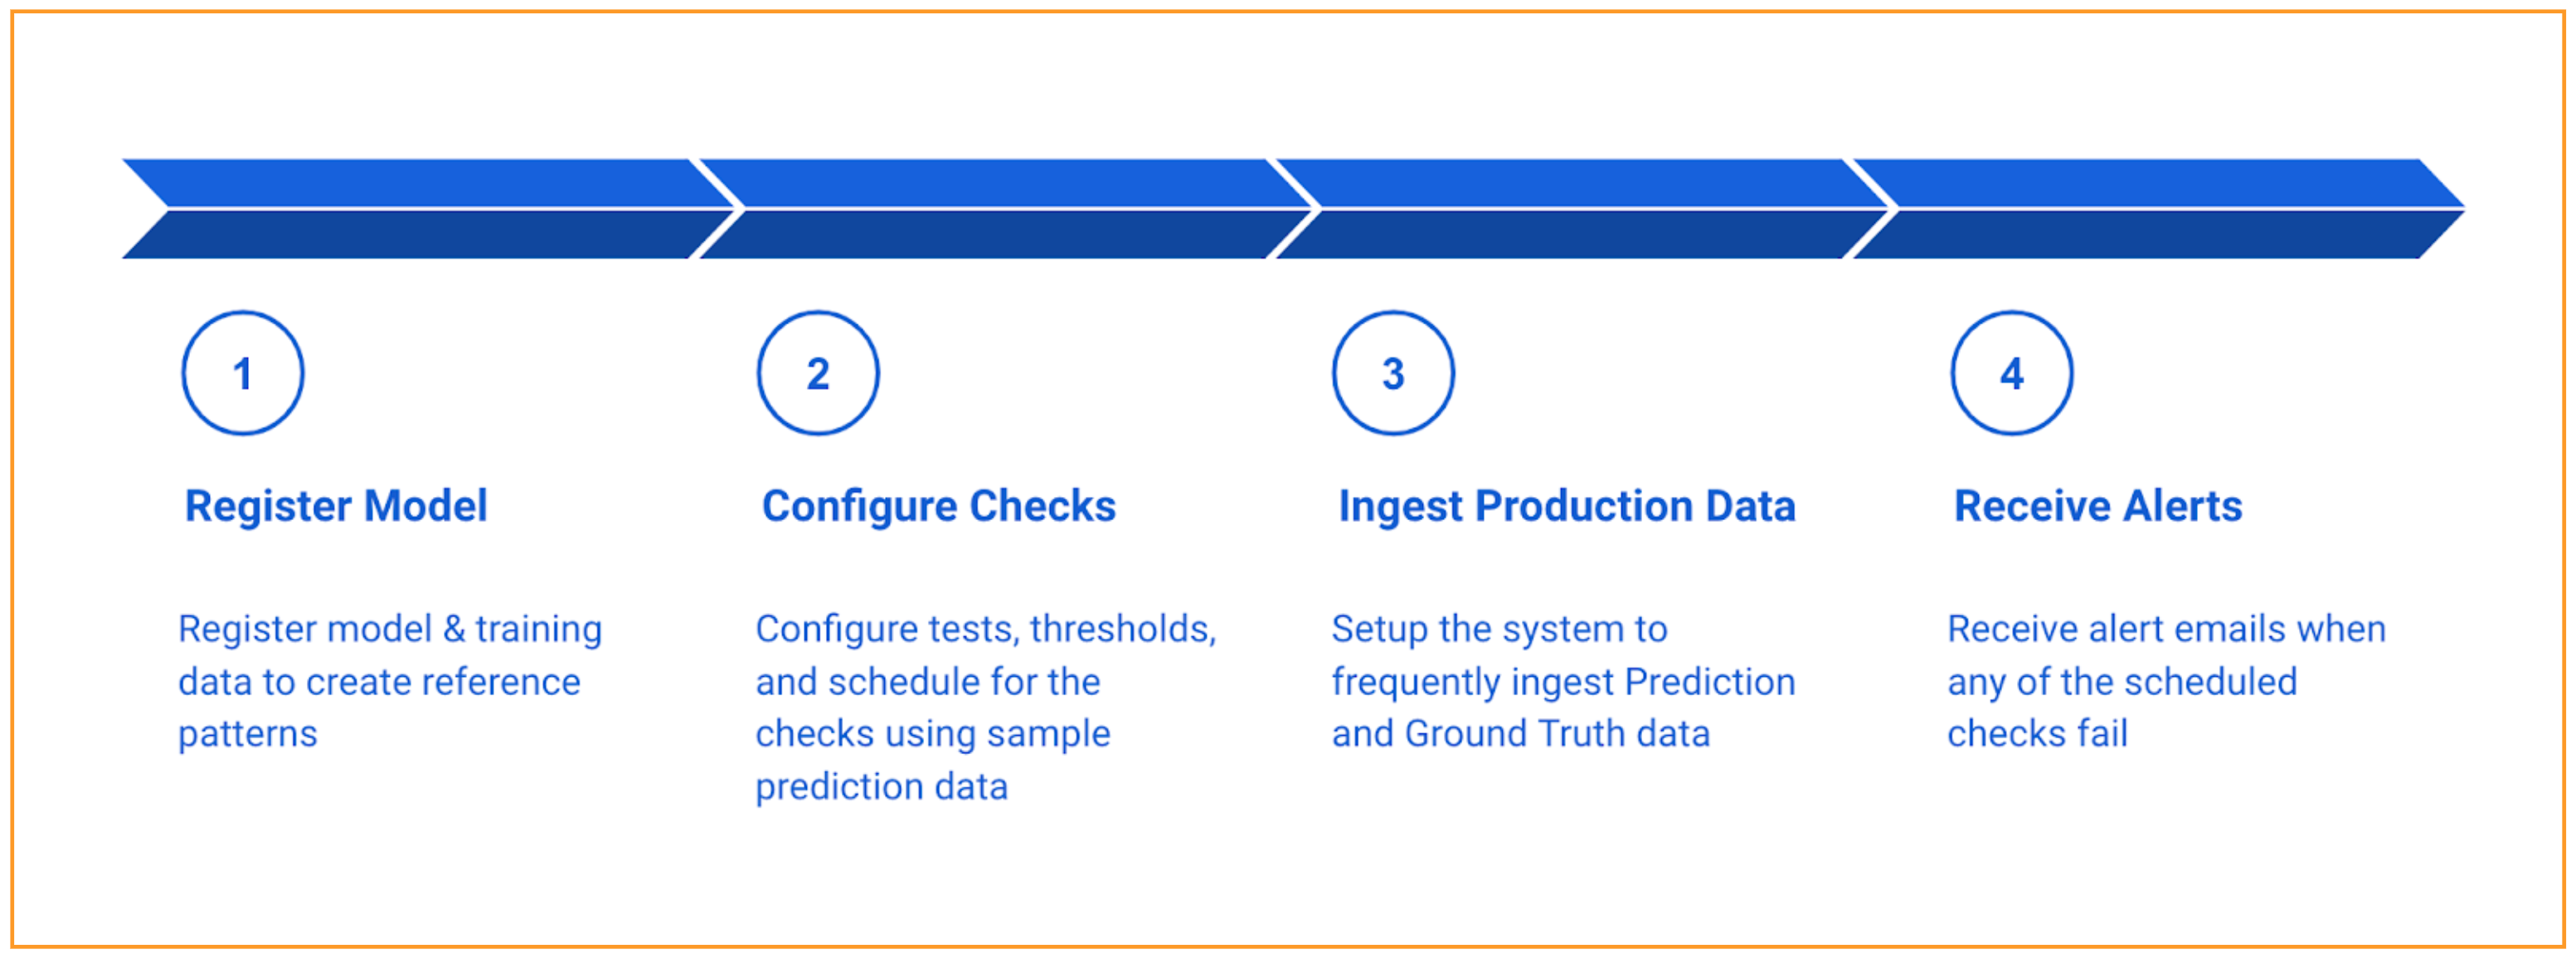
This section will walk you through simple steps to get started on monitoring a model. Before we get into the specific steps, let’s get a high-level overview of the Model Monitor workflow and how the Model Monitor integrates with your system.
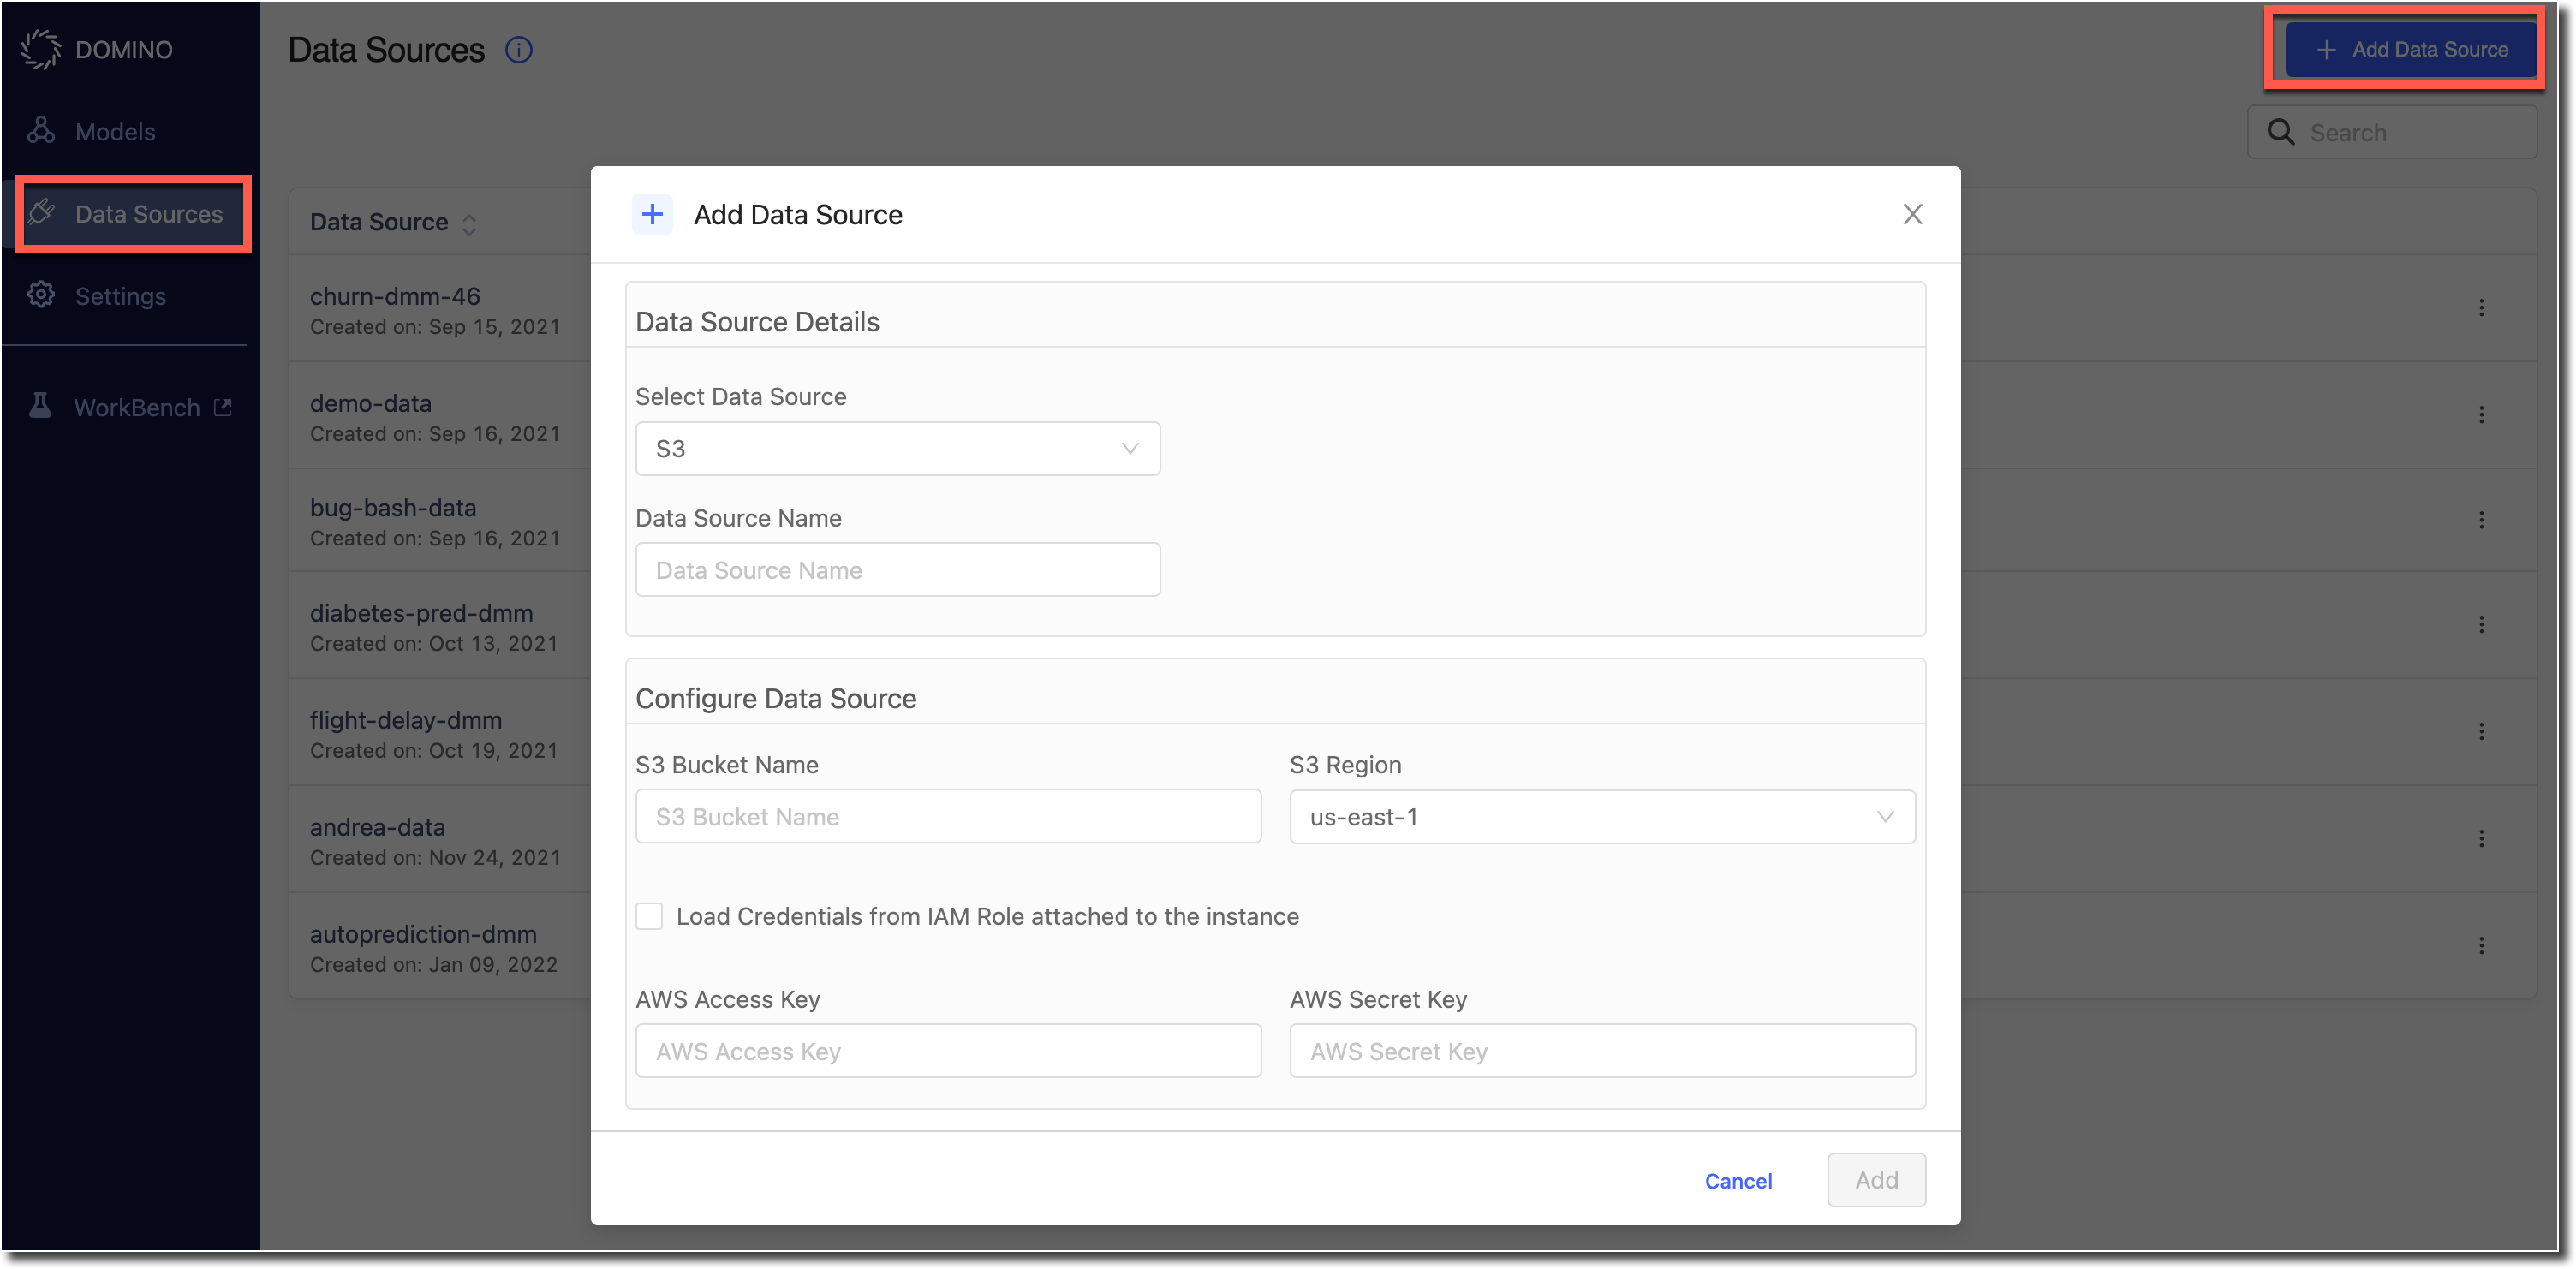
Model monitoring reads and processes the model’s training, predictions and ground truth data from one of the supported data stores. Model monitoring allows you to link different data stores to it so that it can read data from them. To see the list of supported data sources go to Ingest Data in Model Monitoring.
Use the steps below steps to quickly get started with drift detection.
2) Register A Model
-
Go to the Model Dashboard and click Register Model.

-
Upload a Model Config file into the pop-up. A sample file can be seen in Model Registration. Alternatively, you can copy paste the JSON that represents the model config into a JSON editor, also available in the same modal window. This pop-up provides basic JSON validation as well.
-
On clicking Register the model entry is now created in the model monitor.
-
You should see the newly registered model listed in the Models page.
3) Add Prediction Data
-
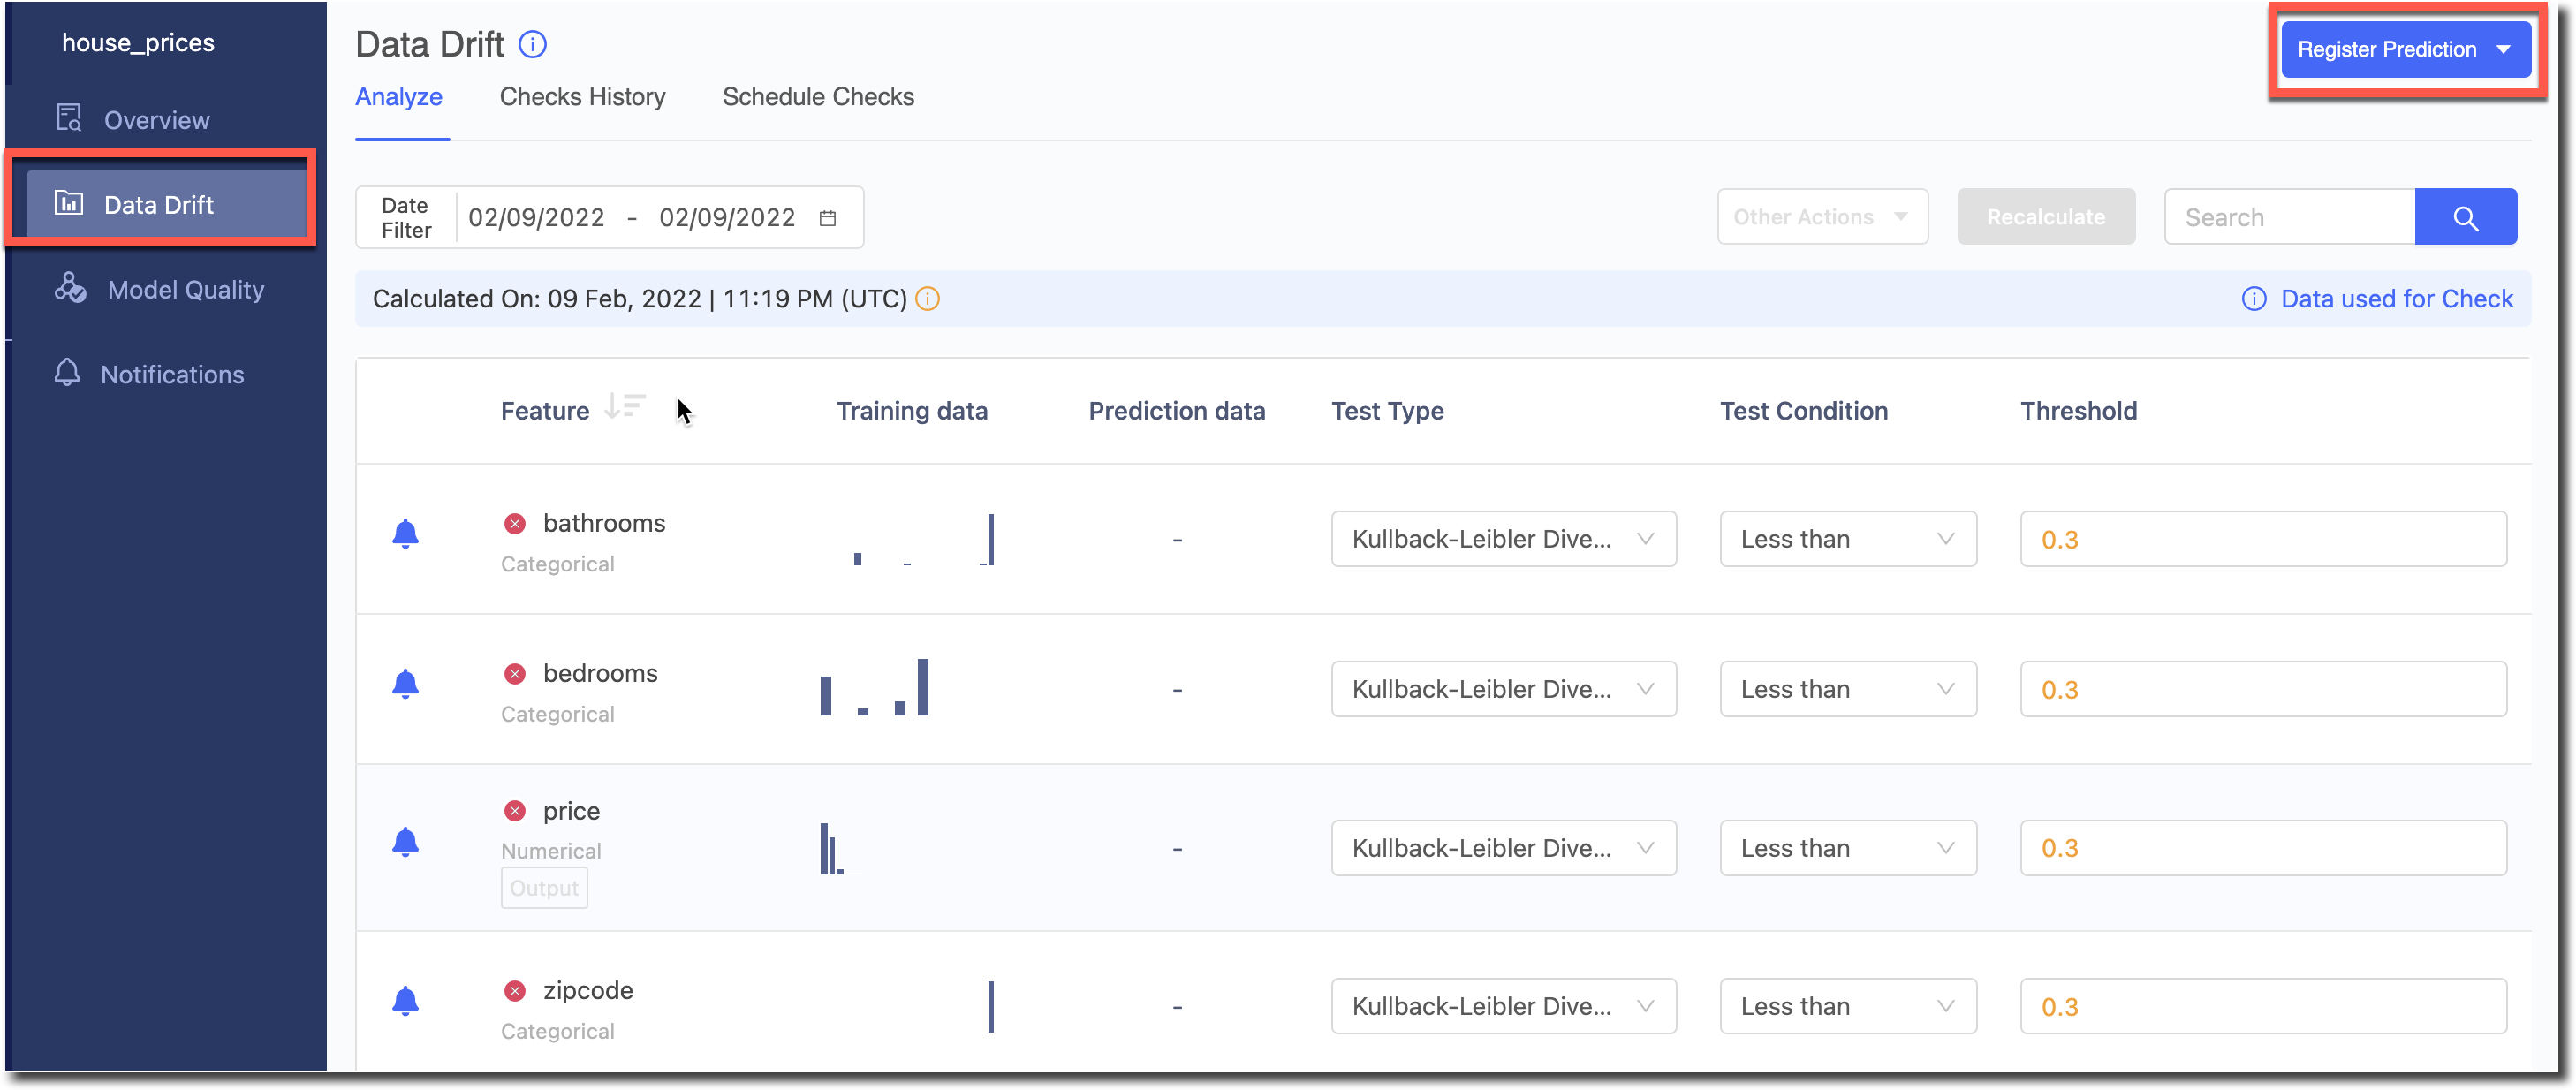
Click on the registered model and go to the Data Drift page.
-
Click on Register Prediction where you will see a pop-up that lets you upload a Prediction Config file. A sample Prediction Config can be seen in Monitoring Data Drift.
-
On clicking Register, the Model Monitor will begin calculation of drift on the registered dataset.
4) Analyze Data Drift
-
After the drift calculations are complete, you should see the divergence value for each feature in the Drift column.
-
The default Test Type and Threshold value will be used for the computation. (You can change the defaults in Settings > Drift Tests Defaults).
-
You can now experiment with other Test Types, Conditions and Threshold values for this dataset.
-
You can filter the data by different Date Ranges to look at Drift and its trends for specific time periods.
-
If your model had a timestamp column declared, then that is used to get the timestamp of different predictions in the dataset. If it was not declared, then the data’s ingestion time in the Model Monitor is taken as its time stamp.
-
You can control which features should be excluded from the Scheduled Checks using the Enable/Disable Alerts toggle icon in the table. This is helpful to reduce alert noise.
-
If you want to save the test types, threshold or other configs, and want to save them as the default config of the model to be used for running scheduled checks, you can save them using Other Actions > Save Checks Config.
-
If you have made experimented with different configs and want to load the model’s default config to reset the Analyze table, you can load them using Other Actions > Restore Checks Config.
5) Add Ground Truth Data
-
After you have added prediction data, you can ingest the model’s ground truth data to monitor the quality of predictions made by the model.
-
For this analysis, it is necessary that a row_identifier column was declared for the model. It is used to match the ground truth labels to the model’s predictions.
-
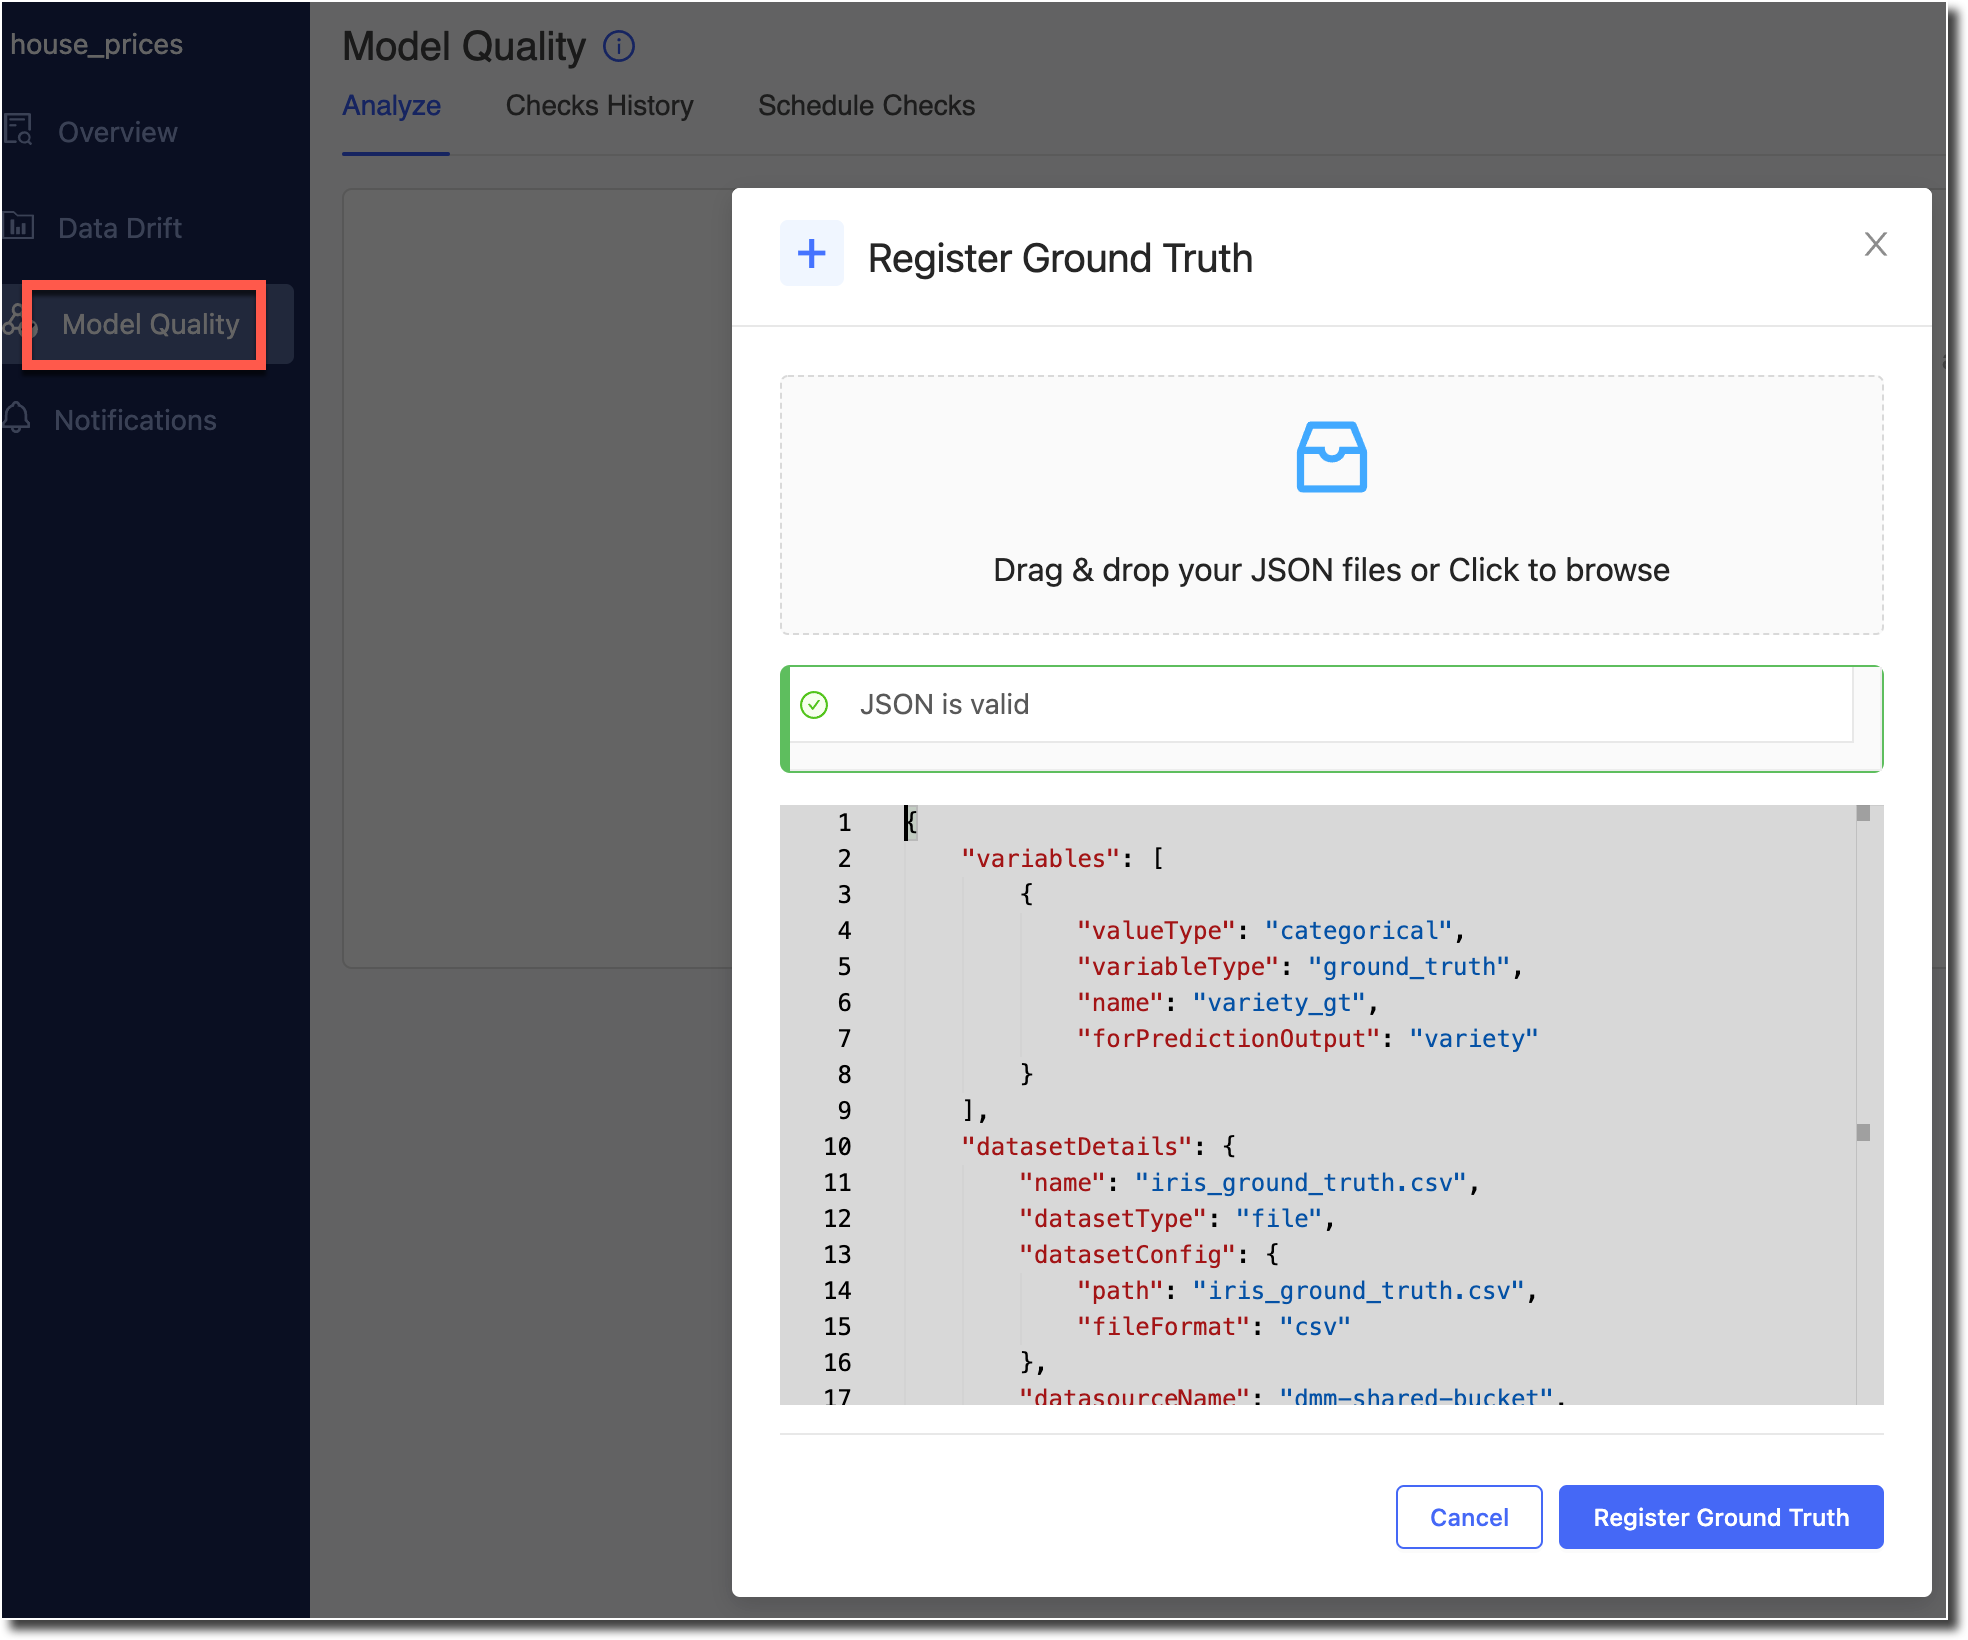
On the Model Quality page of the registered model, click on 'Register Ground Truth'. You will see a pop-up that lets you upload a Ground Truth Config file. A sample Ground Truth Config can be seen in Monitoring Model Quality.
-
On clicking Register, you will be taken to the Model Quality analyze page and the Model Monitor will begin calculation of model quality metrics for this dataset.
-
You can control which metrics should be excluded from the Scheduled Checks using the Enable/Disable Alerts toggle icon in the table. This is helpful to reduce alert noise.
6) Setup Scheduled Checks and Notifications
-
You can also setup checks that run periodically and configure who should be receiving email alert notifications if they fail.
-
Go to the Model’s Notifications section and enter the email ids to which notifications will be sent for this model.

-
Go to the Analyze tab in Data Drift to control which features should be excluded from the Scheduled Checks using the Enable/Disable Alerts toggle icon in the table. This is helpful to reduce alert noise.
-
Now go to the Schedule Checks tab to set the frequency and other parameters.
-
Enter the name for the check.
-
Configure the frequency at which it should be run.
-
In the Select Data to Check options select one:
-
Use data since last check time ensures only predictions with timestamp that fall after the last time the scheduled check ran are considered for the check.
-
Data since last x time period allows to select predictions with timestamp that fall within the last specified x time period (eg. last 3 days) are considered for the check.
-
-
Click Save and the Scheduled Checks get enabled. You can see the historical reports of all the runs in Checks History tab for data drift.
-
Similarly, you can set up Schedule Checks for model quality as well.
-
One important distinction to keep in mind is that while for data drift the timestamp of the predictions is used select data for the schedule checks, in case of model quality it is the ingestion time of the ground truth labels that is used to select data. Refer to the Setting Scheduled Checks for the model section of the documentation for more details.
