Users are advised to configure alerts to their application administrators if the thresholds listed in the Monitoring are exceeded. These alerts indicate potential resourcing issues or unusual usage patterns worth investigating. See Application logs, Domino Admin application, and the Control Center to gather additional information.
Monitoring your systems proactively is crucial, and to assist you, we have provisioned a suite of alerts within Grafana, recommended by Domino. These alerts are based on our extensive experience and insights into common issues and crucial performance metrics. They act as an early warning system and provide immediate insights where more in-depth investigations might be necessary.
Benefits of Domino provided alerts
-
Instant awareness: These alerts offer real-time snapshots of your system’s health and highlight specific components with issues, if any.
-
Quick debugging: Every alert is directly linked to the relevant Grafana dashboard, which enables immediate access to detailed metrics whenever an alert is triggered.
-
Guided troubleshooting: Each alert is accompanied by a runbook that offers step-by-step guidance to resolve common issues associated with the alert.
Domino alerts overview
Domino Alerts are integrated into Grafana. For details on how to access and utilize the provided dashboards in Grafana, refer to the documentation on how to Use Grafana Dashboards.
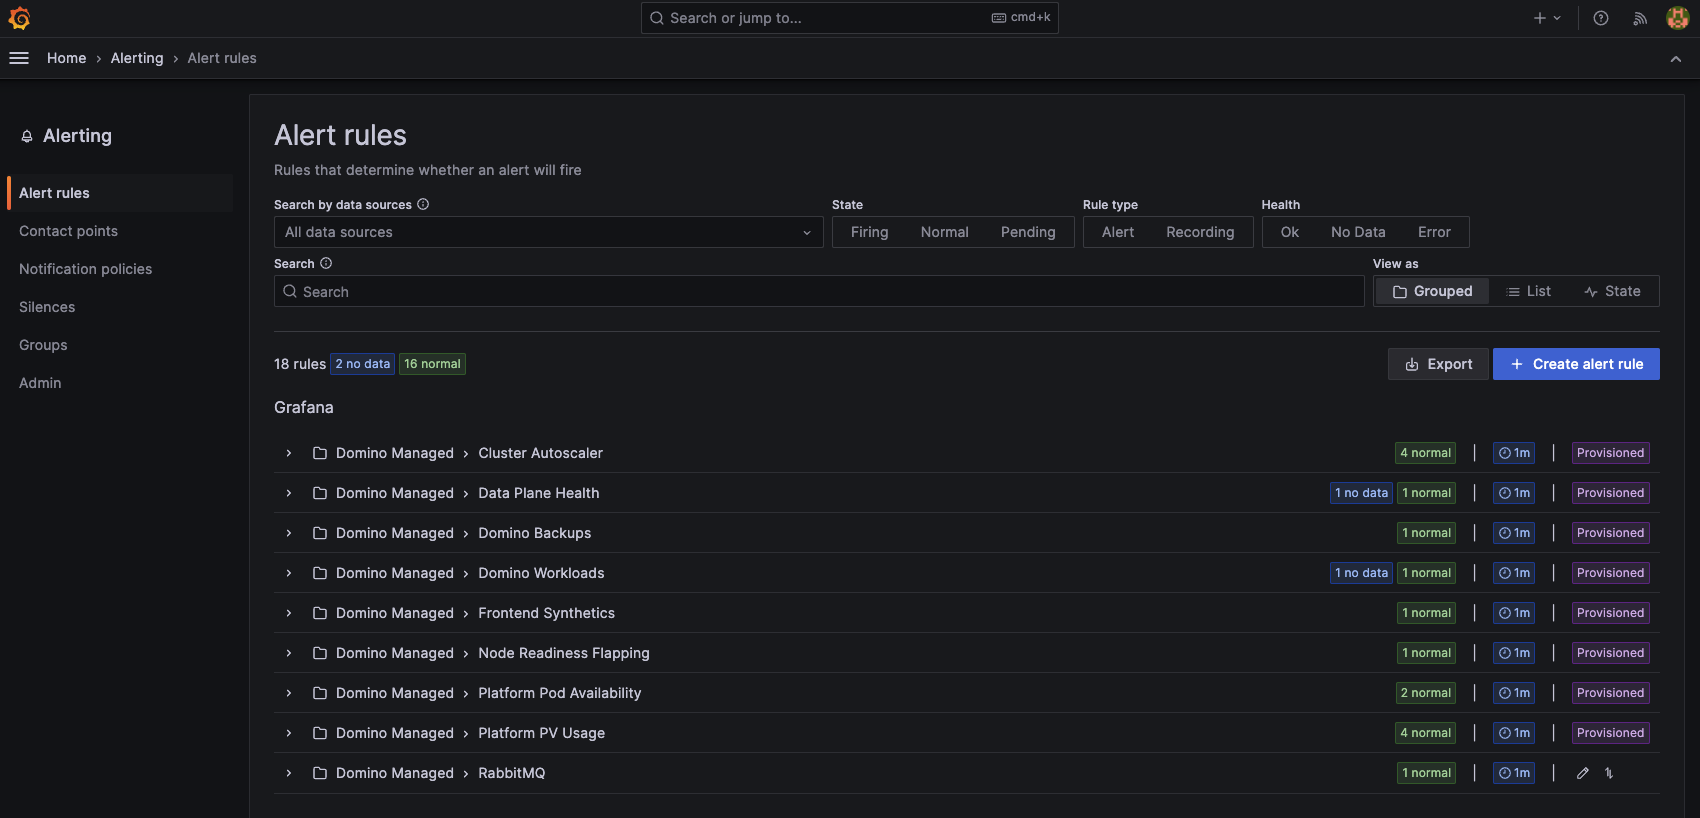
Within Grafana, navigate to Alerting > Alert rules to view a list of alerts provided by Domino.

Alerts in Grafana can be in one of the following three states:
-
Normal:
Representation: Denoted by a green color in Grafana.
Definition: Indicates all monitored metrics are within acceptable thresholds, and no action is required.
User Action: Continue regular monitoring; no immediate action needed. -
Pending:
Representation: Typically depicted by a yellow or other neutral color.
Definition: The alert condition has been met, but not for a sufficiently prolonged period to decisively activate the alert. It signals a possible deviation in the metric.
User Action: Review the alert and identify and rectify any anomalies early. Our alerts are structured to accommodate the dynamic nature of Kubernetes clusters, allowing adjustments before alert state transitions. Observing alerts in “Pending” during such modifications is routine and requires discernment to differentiate between standard adjustments and genuine system irregularities. -
Firing:
Representation: Denoted by a red color, indicating a critical condition.
Definition: The alert condition has persisted beyond the predefined duration, necessitating immediate attention and resolution.
User Action: Address the issue promptly. Refer to the linked dashboard for in-depth analysis and the associated runbook for resolution steps.
Domino Alerts are designed to notify you of potential issues and assist in their diagnosis and resolution, while also providing an overview of platform health.
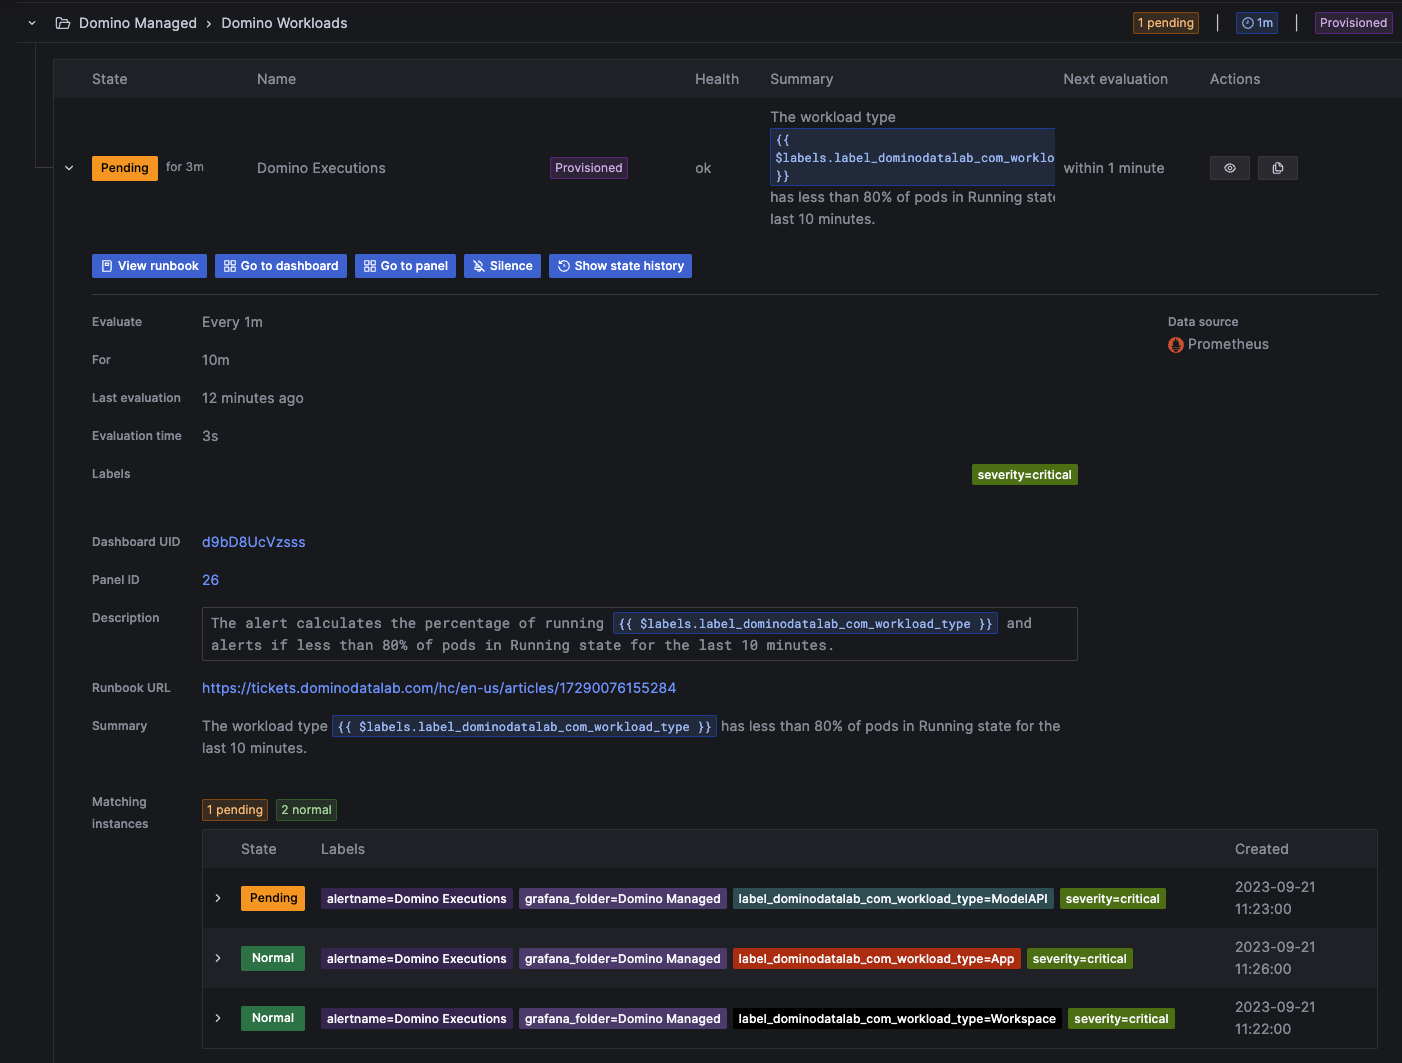
For example, consider the Domino Workloads Alert:

In this instance, a top-level alert is marked as Pending. A closer look reveals the alert status across various workload types. It indicates that our Apps and Workspaces are healthy, but there might be an issue with our Model APIs.
This alert triggers if, during a 10-minute window, less than 80% of any particular workload type is in the running state. From here, you can access the specific runbook and dashboards for a detailed investigation into the potential issue, assisting in quick resolution and deeper understanding.
Proper configuration of alert notifications is crucial to ensure that your team is promptly informed of any issues. By default, alerts in Grafana will only be visible in the Grafana UI, which may not be sufficient in promptly addressing system issues. Configure contact points to send alerts to designated receivers, such as email or Slack, for immediate awareness and action on potential system irregularities.
Configure contact points
A contact point in Grafana is a designated recipient of alert notifications, such as an email address or a Slack channel. To ensure that alerts aren’t limited to the Grafana UI, it’s necessary to configure contact points. For effective proactive monitoring, it’s essential to ensure that contact points are appropriately configured.
Below are two examples of commonly used contact points for configuring alert notifications in Grafana. Refer to the Grafana documentation for more details and additional contact point options.
SMTP email alerts
To enable SMTP email notifications, the grafana.ini file in the Kubernetes config map needs modification:
kubectl edit cm grafana -n domino-platformYour grafana.ini section should resemble the following:
[smtp]
enabled = true
host = smtp.example.com:587
user = myuser
password = mypassword
;cert_file =
;key_file =
skip_verify = false
from_address = admin@example.com
from_name = Grafana
Replace the relevant values with your SMTP server details.
Then, navigate to Alerting > Contact points in Grafana and set up the email contact point with the corresponding email addresses.
Slack alerts
To enable Slack notifications, a webhook URL from Slack is required. Follow the steps below to create a Slack notification channel:
-
Navigate to the settings page of your Slack app.
-
Click on Incoming Webhooks.
-
Activate incoming webhooks, and click on Add New Webhook to Workspace.
-
Choose a channel for posting alerts and click Allow to generate a webhook URL.
Once you have the webhook URL:
-
In Grafana, navigate to Alerting > Contact points.
-
Click on Add contact point.
-
Select Slack as the type and provide a name for the notification channel.
-
Paste the webhook URL in the Url field.
|
Note
|
|
With the setup complete, your team will receive notifications and stay aware of the state of your Domino system via both email and Slack, which will enhance responsiveness to any issues that may arise.
Notification policies in Grafana
Notification policies manage how and when your notifications should be sent, allowing customization based on alert severity and frequency.
To create a Notification Policy, navigate to Alerting > Notification Policies in the Grafana sidebar and modify the default contact point to the one you created above.
