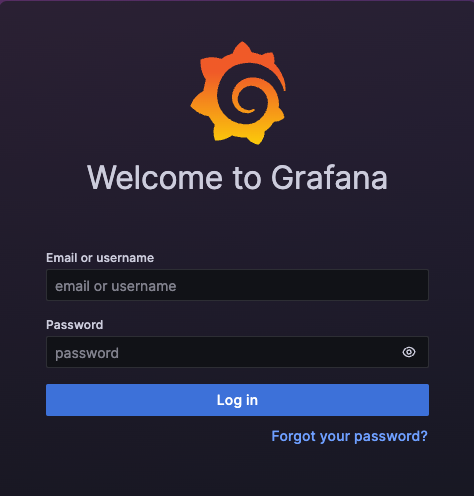
Domino comes with a set of default Grafana dashboards. Many of the Domino platform services have corresponding Grafana dashboards. There are also several dashboards for Kubernetes observability.
Grafana is available at the URL https://<your-domino-domain>/grafana
Get the Grafana password
The Grafana Admin password is stored in a secret called grafana in the domino-platform namespace.
Retrieve the password with kubectl:
kubectl get secret -n domino-platform grafana -ojsonpath='{.data.admin-password}'| base64 -d; echoNavigate to the Grafana login page:

-
Enter the Email or username as
grafana. -
Enter the password you retrieved above.
-
Click Log in.
You’ll find many dashboards available in Grafana. The ones described here are especially useful.
Kuberhealthy
Use the Kuberhealthy dashboard as your single source of truth for all defined synthetic checks for basic Kubernetes cluster functionality deployed as part of Domino.
You can see panels such as the following:
- Kuberhealthy Check Status
-
Determines if a synthetic test defined has failed. You can see each test with a result of 1 (succeeded) or 0 (failed) with the time it last ran the check.
- Kubernetes Check History
-
Shows a historical view of when the checks failed.