Domino comes with a set of default Grafana dashboards. Many of the Domino platform services have corresponding Grafana dashboards. There are also several dashboards for Kubernetes observability.
Grafana is available at the URL https://<your-domino-domain>/grafana
Get the Grafana password
The Grafana Admin password is stored in a secret called grafana in the domino-platform namespace.
Retrieve the password with kubectl:
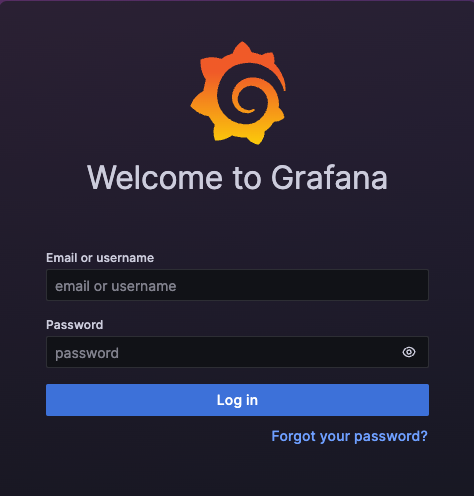
kubectl get secret -n domino-platform grafana -ojsonpath='{.data.admin-password}'| base64 -d; echoNavigate to the Grafana login page:

-
Enter the Email or username as
grafana. -
Enter the password you retrieved above.
-
Click Log in.
You’ll find many dashboards available in Grafana. The ones described here are especially useful.
General / Keycloak JVM dashboard
Keycloak pods are responsible for user authentication and session management. A Java Virtual Machine (JVM) executes the program that performs these responsibilities. The Keycloak JVM Dashboard shows the overall status of Keycloak pods, metrics about JVM resource usage, including heap and non-heap memory usage, garbage collection stats, and thread counts. You can use this dashboard to help understand performance or scaling issues related to Domino’s authentication engine.
General / Nucleus Dispatcher JVM Metrics: Current Pod
The nucleus-dispatcher is a Kubernetes pod that has several important responsibilities within the Domino system, including dispatching runs to begin execution.
A Java Virtual Machine (JVM) executes the program that performs these responsibilities.
The Nucleus Dispatcher JVM Metrics: Current Pod dashboard shows metrics about JVM resource usage, including heap and non-heap memory usage, garbage collection stats, and thread counts.
You can use this dashboard to help understand performance or scaling issues related to Domino’s execution engine.
This dashboard shows the JVM stats for the currently-running nucleus-dispatcher Kubernetes pod.
There are also similar JVM metrics dashboards for other Nucleus Kubernetes pods that perform less critical roles, such as nucleus-train and nucleus-workspace-volume-snapshot-cleaner.
General / Nucleus Dispatcher JVM Metrics: All Pods Including Terminated
This dashboard shows the same metrics as the Nucleus Dispatcher JVM Metrics: Current Pod dashboard, but for all historical pods that still have metrics in the system. This dashboard is useful for viewing resource usage across pod restarts.
There are also similar historical metrics dashboards for other Nucleus Kubernetes pods.
