Grafana is available at the URL https://<your-domino-domain>/grafana
or through the Domino Admin UI under Advanced > Grafana Monitoring.
Out of the box, Grafana should be configured with SSO so that users with a SysAdmin role will automatically be logged in to the Grafana UI if they are logged in to Domino. If they are not currently logged in to Domino or their session has expired, they will see the Grafana login screen.
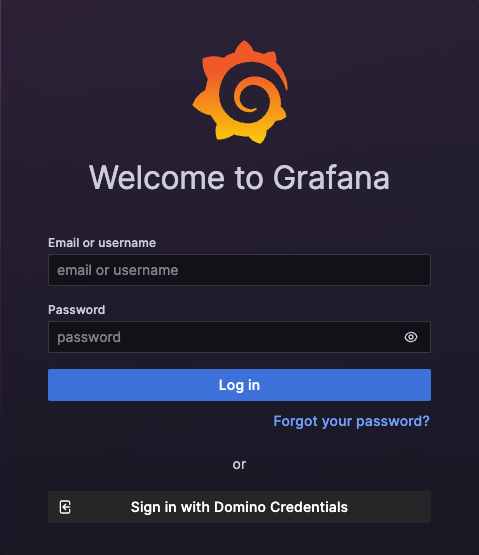
Clicking on Sign in with Domino Credentials will take the user to the normal Domino login screen where they can log in using their Domino credentials as normal. Once logged in, Domino will redirect back to the Grafana UI.
All Domino SysAdmin users are automatically granted the Grafana Admin role.
In situations where SSO is not working (for example, Keycloak is unavailable for some reason), there is a backup method to access Grafana with Admin privileges, as detailed below.
-
Get the Grafana password:
The Grafana Admin password is stored in a secret called
grafanain thedomino-platformnamespace. Retrieve the password withkubectl:kubectl get secret -n domino-platform grafana -ojsonpath='{.data.admin-password}'| base64 -d; echoNoteIn some cases, namespaces may vary across deployments. -
Navigate to the Grafana login page:
-
Enter the Email or username as
grafana. -
Enter the password you retrieved above.
-
Click Log in.
-