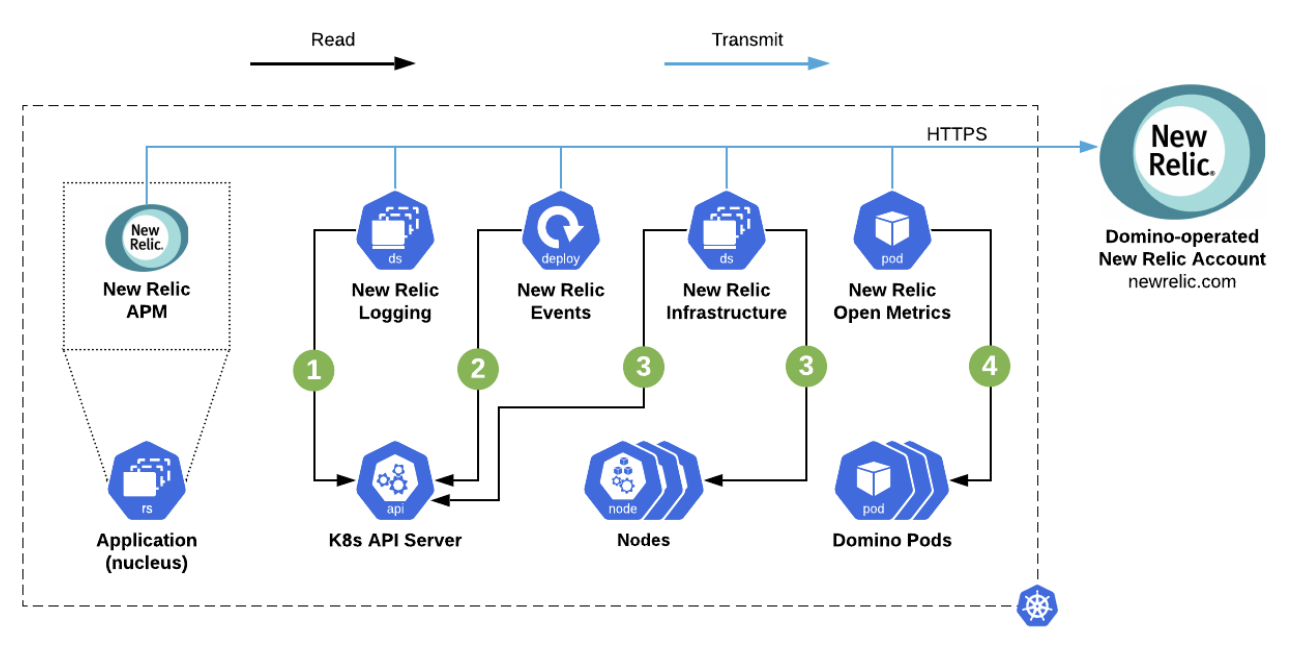
Domino uses New Relic to enable developers, operations, and tech teams to measure and monitor the health and performance of their applications and infrastructure to achieve the following:
-
Help Domino understand system load for right-sizing and upgrade planning.
-
Send proactive and reactive alerts, which trigger Domino’s paging systems.
-
Provide general visibility of real-time and historical system health.
-
Store aggregated application logs for reference and analysis.
Telemetry from Domino-deployed New Relic agents is sent via HTTPS to newrelic.com domains. These agents will be initialized with a New Relic API key provided by Domino that will authenticate them to New Relic. The New Relic agents take a standard proxy configuration, which can be provided at install time to comply with requirements for proxied internet egress.
Official information about networks, IP addresses, domains, ports, and endpoints used by New Relic is available from New Relic.
Data is stored in Domino’s New Relic account in a dedicated project with the customer’s unique ID, and data is retained for 30 days.
Domino deploys five types of New Relic agent resources to collect different types of data.

Infrastructure
New Relic Infrastructure agents are deployed as a DaemonSet and they collect common operational metrics from the worker infrastructure, such as CPU, memory, disk utilization and performance, and active workloads. This data is used to build a picture of cluster health and provide visibility into system load.
Metrics
A single New Relic Open Metrics pod is deployed to collect time series data about application component performance via metrics endpoints available from those component services. This targets component endpoints via labels, similar to Prometheus.
Only whitelisted metrics data is transmitted to the upstream Domino New Relic account, including:
-
Cluster Autoscaler performance and configuration.
-
Custom Domino metrics.
All New Relic agents deployed and used by Domino only send:
-
Application performance metrics.
-
Application logs.
-
Kubernetes performance, configuration, and resource information.
New Relic agents deployed by Domino never send:
-
Data uploaded or created by users.
-
Credentials, passwords, or secrets.
-
Personally identifiable information.
