For this tutorial we’ll use the Titanic data.
-
The Titanic data have been assigned to a variable named
df. -
Hover over the
 icon. Select the Transformations item from the popup menu.
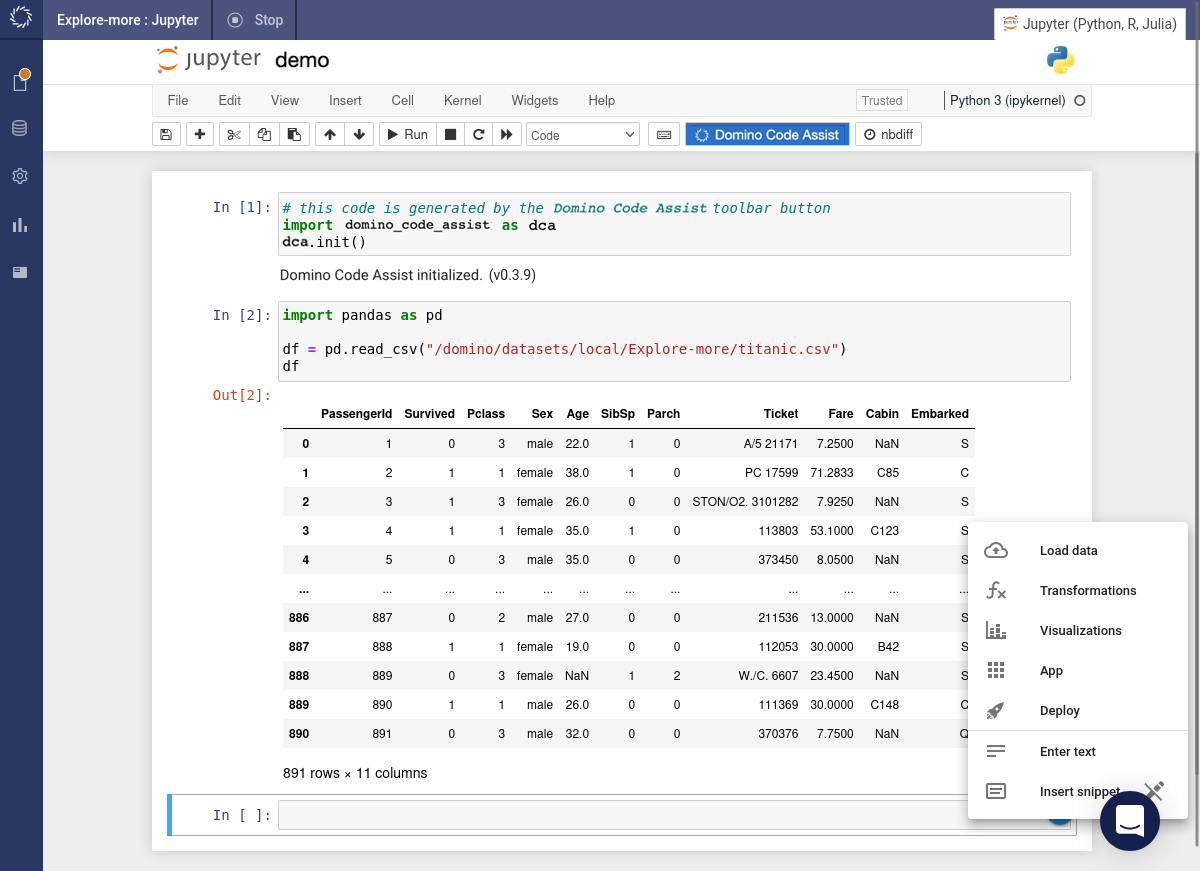
-
The Transformations dialog appears. Select the target variable from the dropdown menu and preview the data.
-
Click on the kebab icon to the right of any of the
nanvalues in theCabincolumn. Then click on the Filter values like this popup button.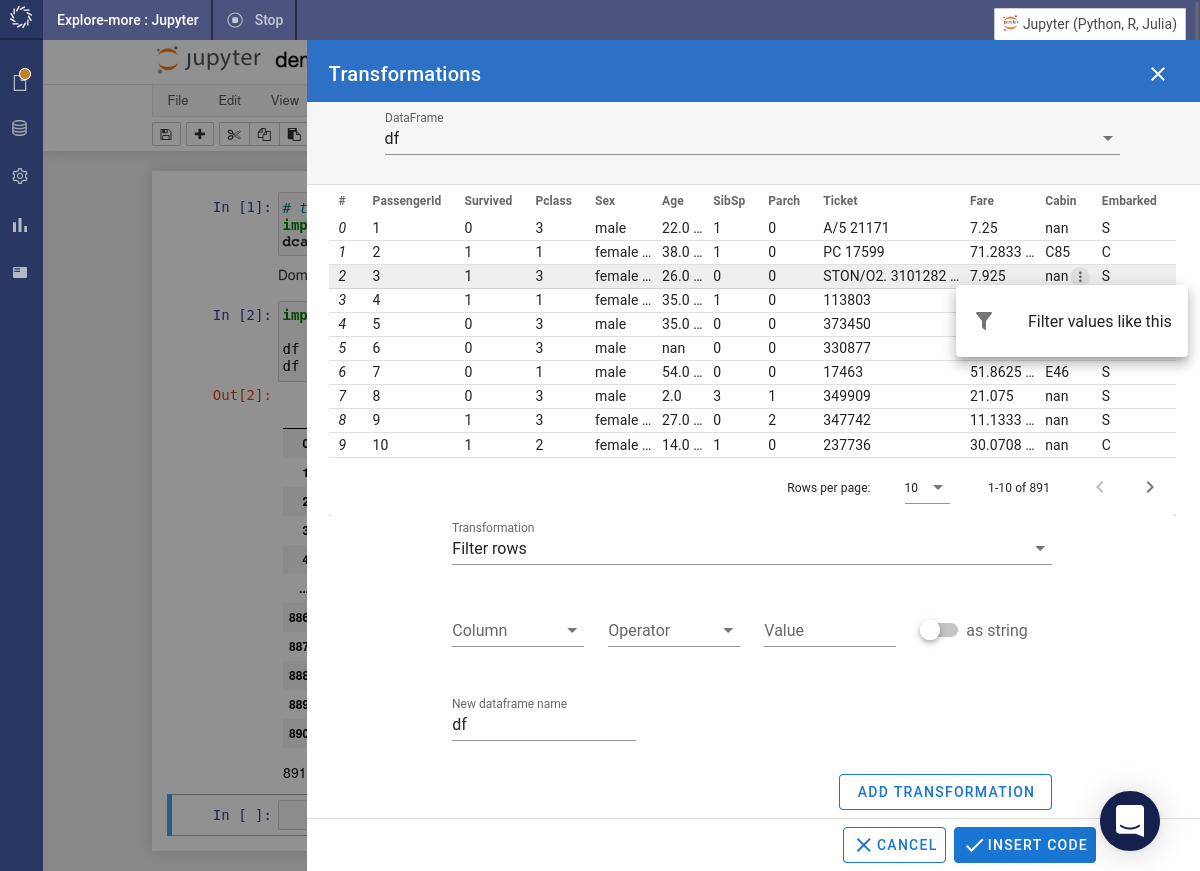
-
A dialog appears with fields to choose a column, an operator and a value. The value is set to
nanby default. -
Since we are wanting to exclude records with missing values, we change the operator from
==to!=. Press the button.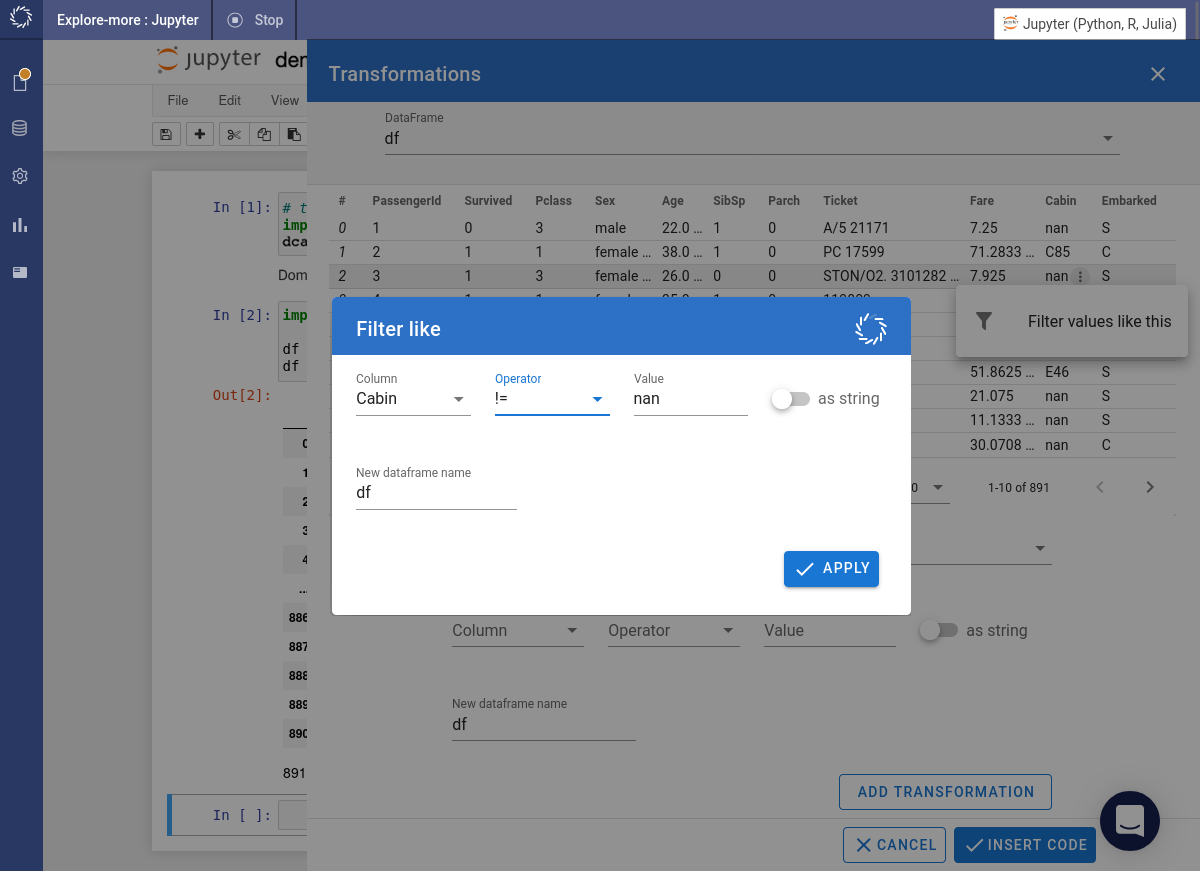
-
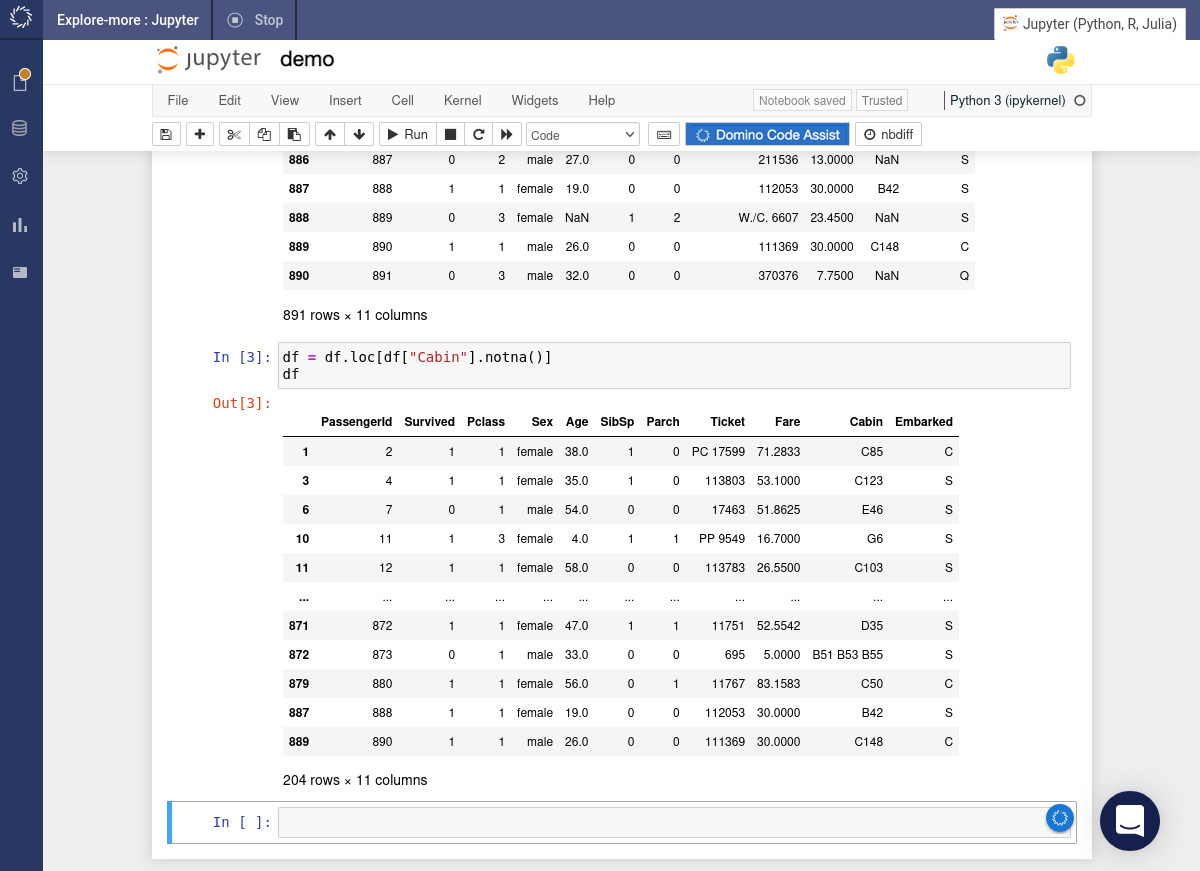
The required code is inserted into the notebook and immediately executed.
-
Under the Column selector choose
Embarked. SetOperatorto==andValuetoS. Turn theas stringtoggle on. Press the button.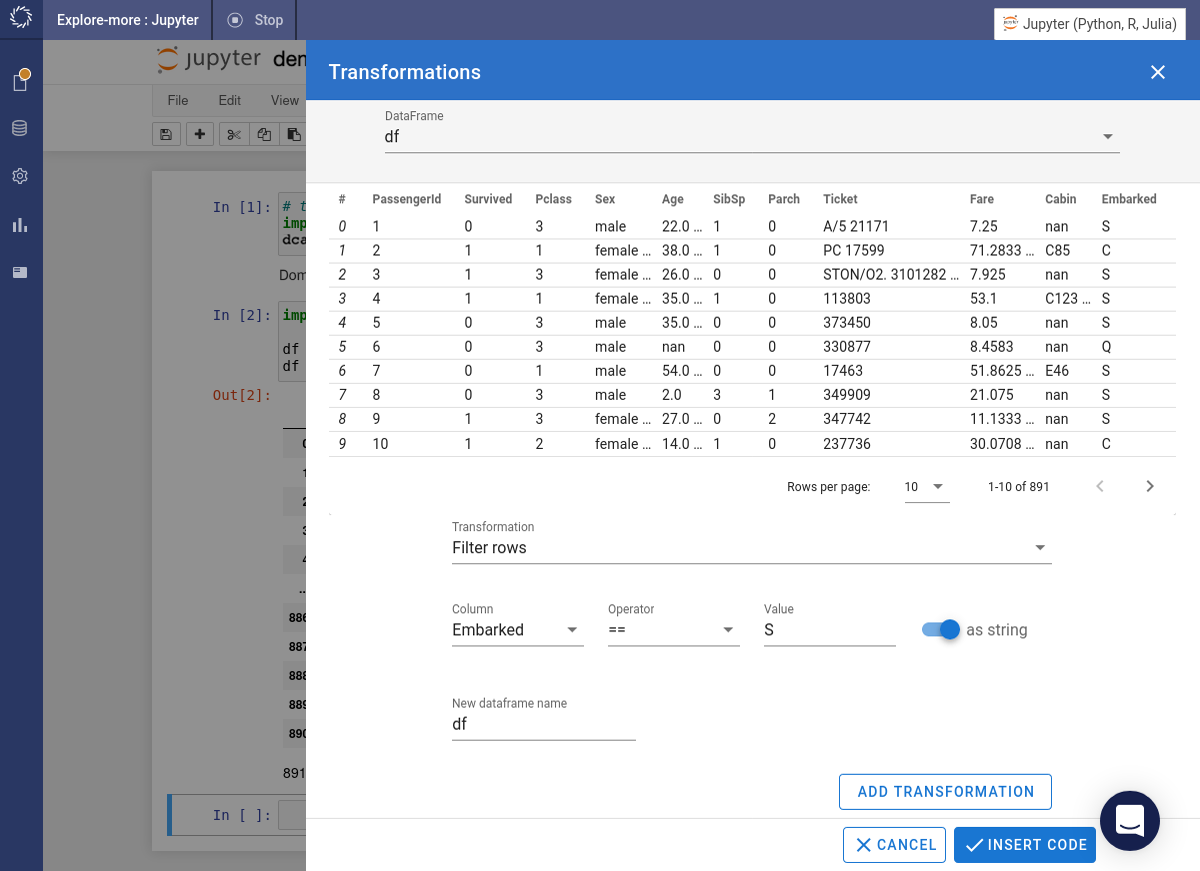
-
The preview is updated to show only those records where
Embarkedis"S". -
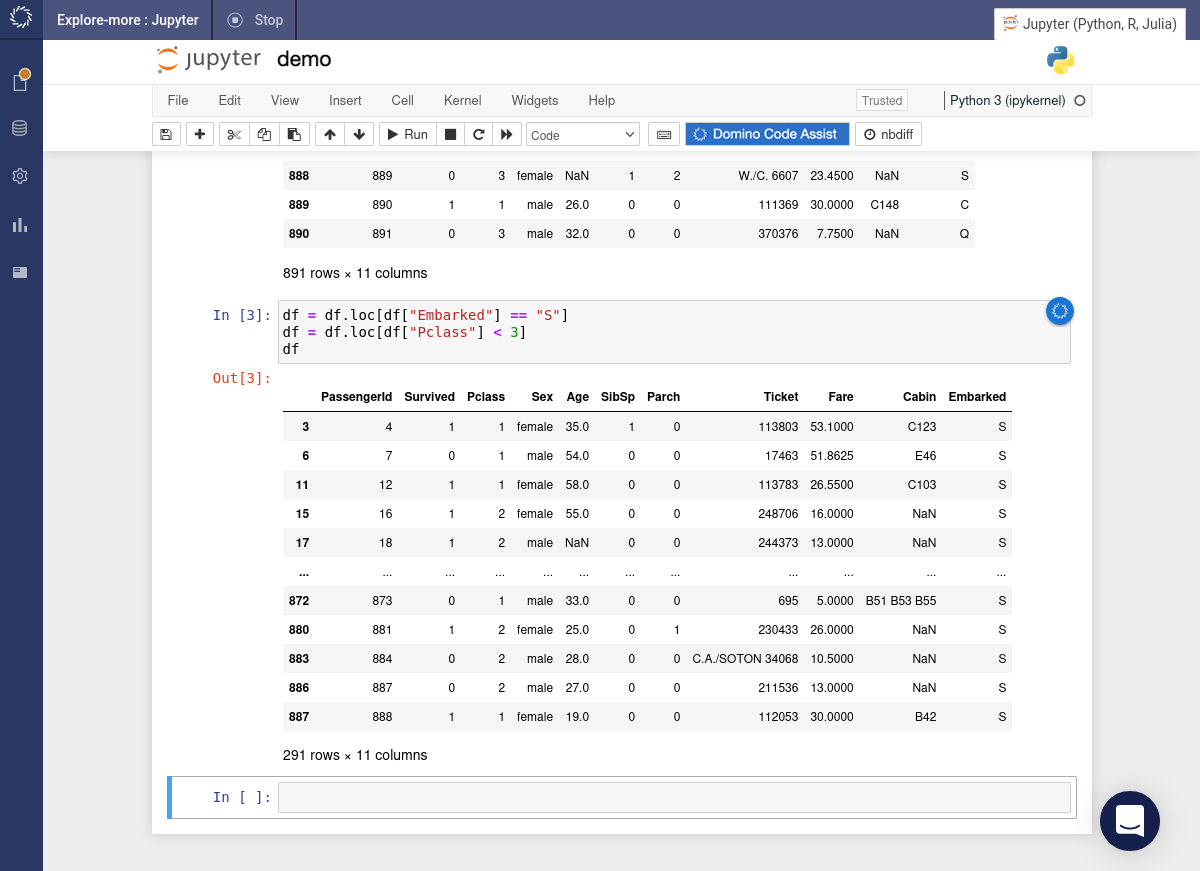
Under the Column selector choose
Pclass. SetOperatorto<andValueto3. Press the button. -
The preview is updated to show only those records where
Embarkedis"S"andPclassis less than 3. Press the button. -
The required code is inserted into the notebook and immediately executed.
-
Group and aggregate records to generate summary data.