The Transformations widget can be used to chain together multiple operations.
For this tutorial we’ll use the Titanic data.
-
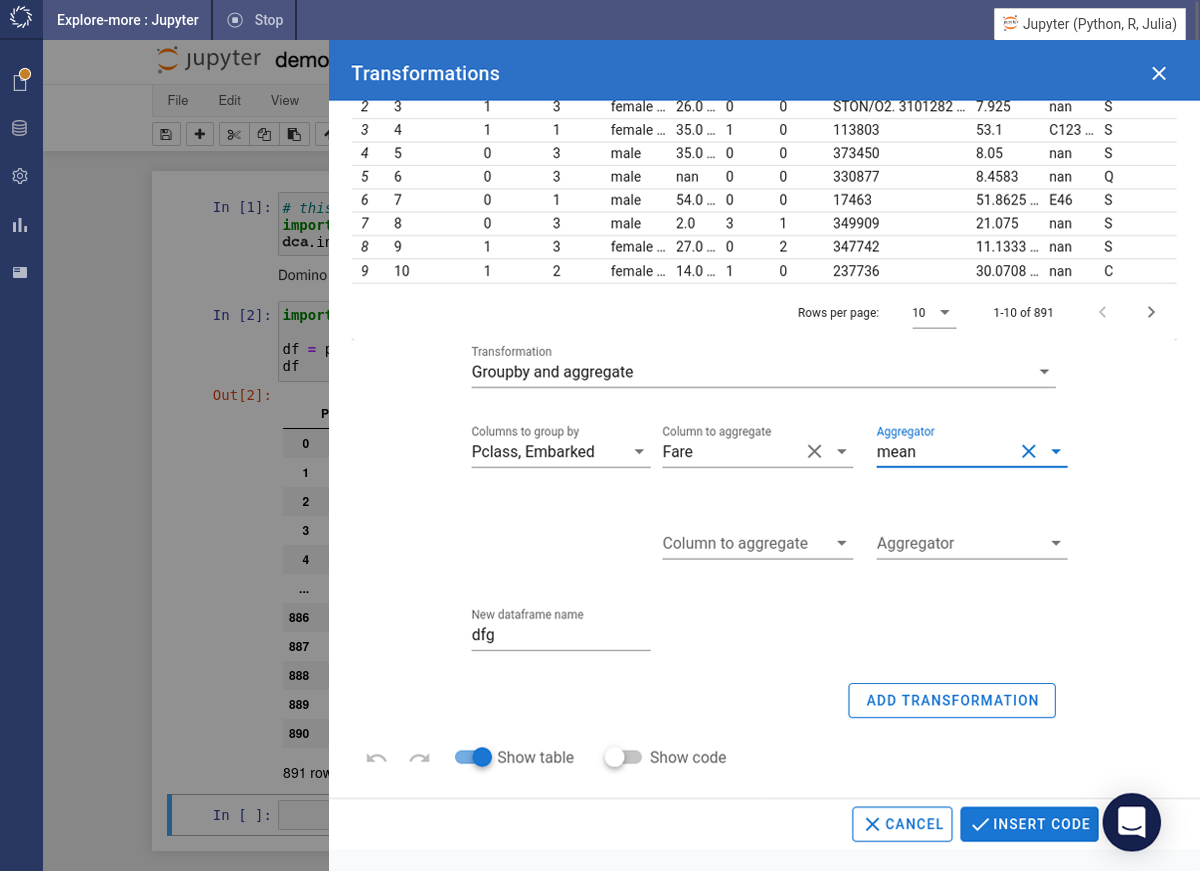
Hover over the icon. Select the Transformations item from the popup menu. Select the Groupby and aggregate option.
-
Specify
PclassandEmbarkedas the columns to group by. ChooseFareas the column to aggregate. Selectmeanas the aggregator function. Press the button.
-
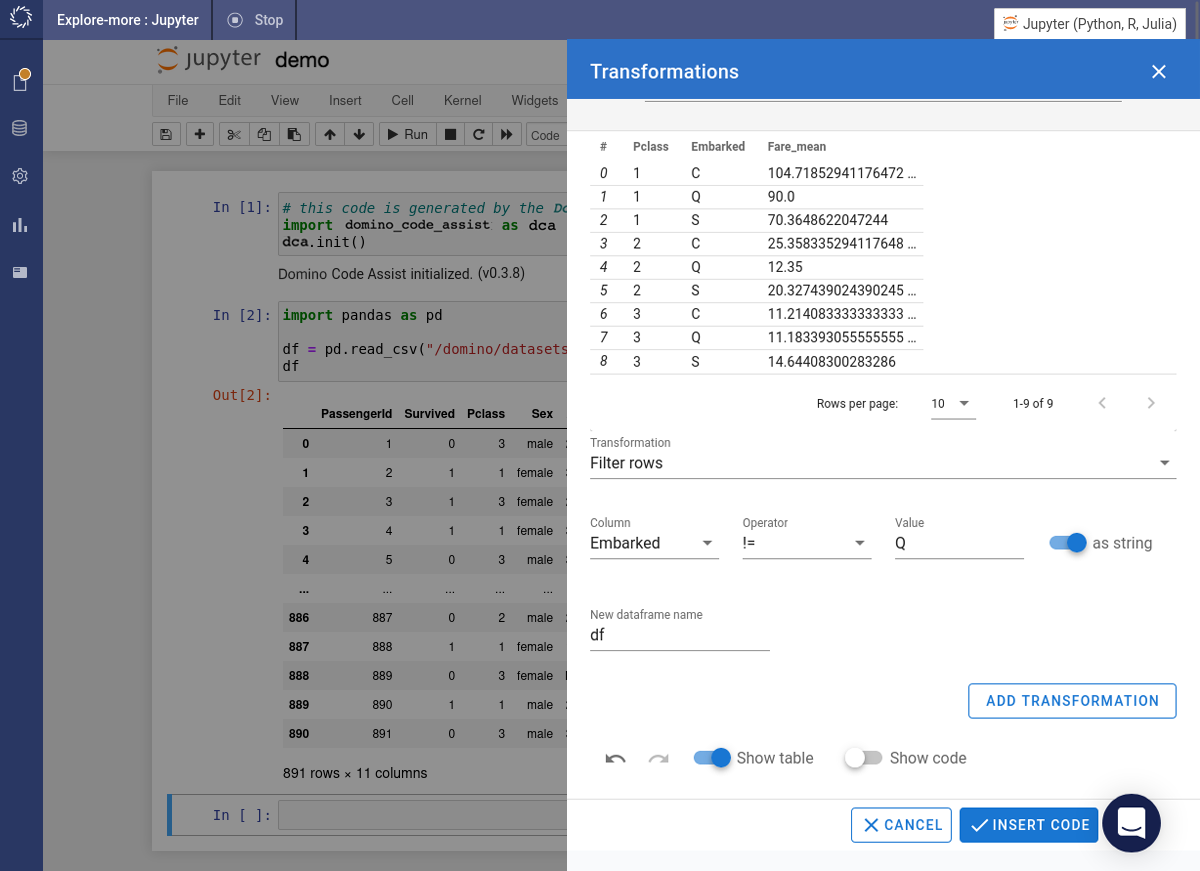
The preview is updated with the summary data.
-
Next we’re going to filter the rows. Specify
Embarkedas the columns to filter by. Choose!=as the operator andQas the value. Turn theas stringtoggle on. Press the button.
-
The preview is updated with the filtered data. Finally select the Drop columns option and specify
Embarkedas the column to drop. Press the button. -
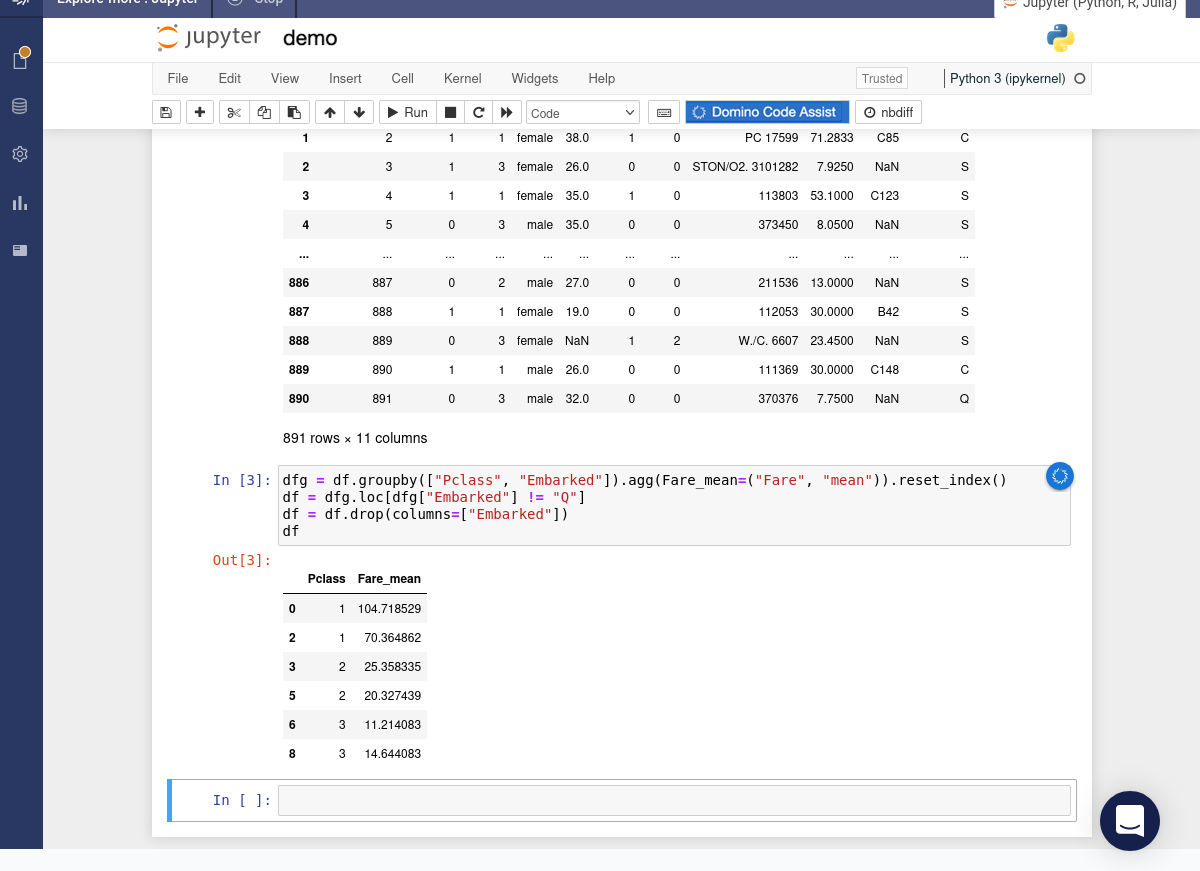
The preview is updated. Press the button.
-
The required code is inserted into the notebook and immediately executed.

