Use Ray Tune and Domino to expedite hyperparameter tuning by distributing it at scale. While you have the freedom to use any library in Domino, this guide uses Ray Tune and MLflow to tune models and evaluate results.
Domino helps you manage Ray cluster infrastructure with on-demand clusters, but before you use Ray clusters, you must first setup Ray clusters in Domino.
In this example, you tune a PyTorch Lightning classifier on the MNIST dataset. You’ll use Ray Tune to run permutations on layer size, learning rate, and batch size. Import the RayTune GitHub reference project into Domino:
-
In the Domino navigation pane, click Projects > New Project.
-
In the Create new Project window, enter a name like "Ray Tune example".
-
Under Hosted By, select Git Service Provider > GitHub
-
For Git Repository URL, enter "https://github.com/ddl-jwu/ray-tune".
-
In the project, launch a Ray-enabled VSCode Workspace and load train.py to explore the training script.
-
In VSCode, open a terminal and type
python train.pyto run the script.
The following code snippet from train.py configures the RayTune parameter grid and gets the MLflow tracking URI that comes pre-configured for Domino projects:
def tune_mnist(num_samples=4, num_epochs=5, gpus_per_trial=0, data_dir="~/data"):
    config = {
        "layer_1_size": tune.choice([16, 32, 64]),
        "layer_2_size": tune.choice([32, 64, 128]),
        "lr": tune.loguniform(1e-4, 1e-1),
        "batch_size": tune.choice([32, 64]),
        "mlflow": {
            "experiment_name": "ray-tuning",
            "tracking_uri": mlflow.get_tracking_uri()
        }
    }
Each permutation of the parameters produces a single run, and all runs are grouped under the same experiment. One epoch covers an entire data pass through the neural network during training. Logging is done at the epoch level. For more information on experiment tracking, see Track and monitor experiments with MLflow.
You can also run the training script as a job to remove the workspace creation steps. Jobs are useful automation mechanisms in Domino.
-
In the project you imported from GitHub in the previous section, click Jobs.
-
Configure a run with train.py.
This job runs the train.py script. An information icon on the right side under Results shows the experiments associated with the job. Click the link to explore them.
To view an individual trial, follow these steps:
-
Click the Experiments link to see the trials logged by a workspace or the information icon to see the trials logged by a job.
-
Click an individual trial and the Metrics tab to see the full-time-series metrics.
-
Look for the general trend of the metrics over time, especially with deep-learning scenarios where compute costs drive decisions. If your accuracy shows slight or no improvement, there’s no point in using more resources to go down this path.
To compare trial results:
-
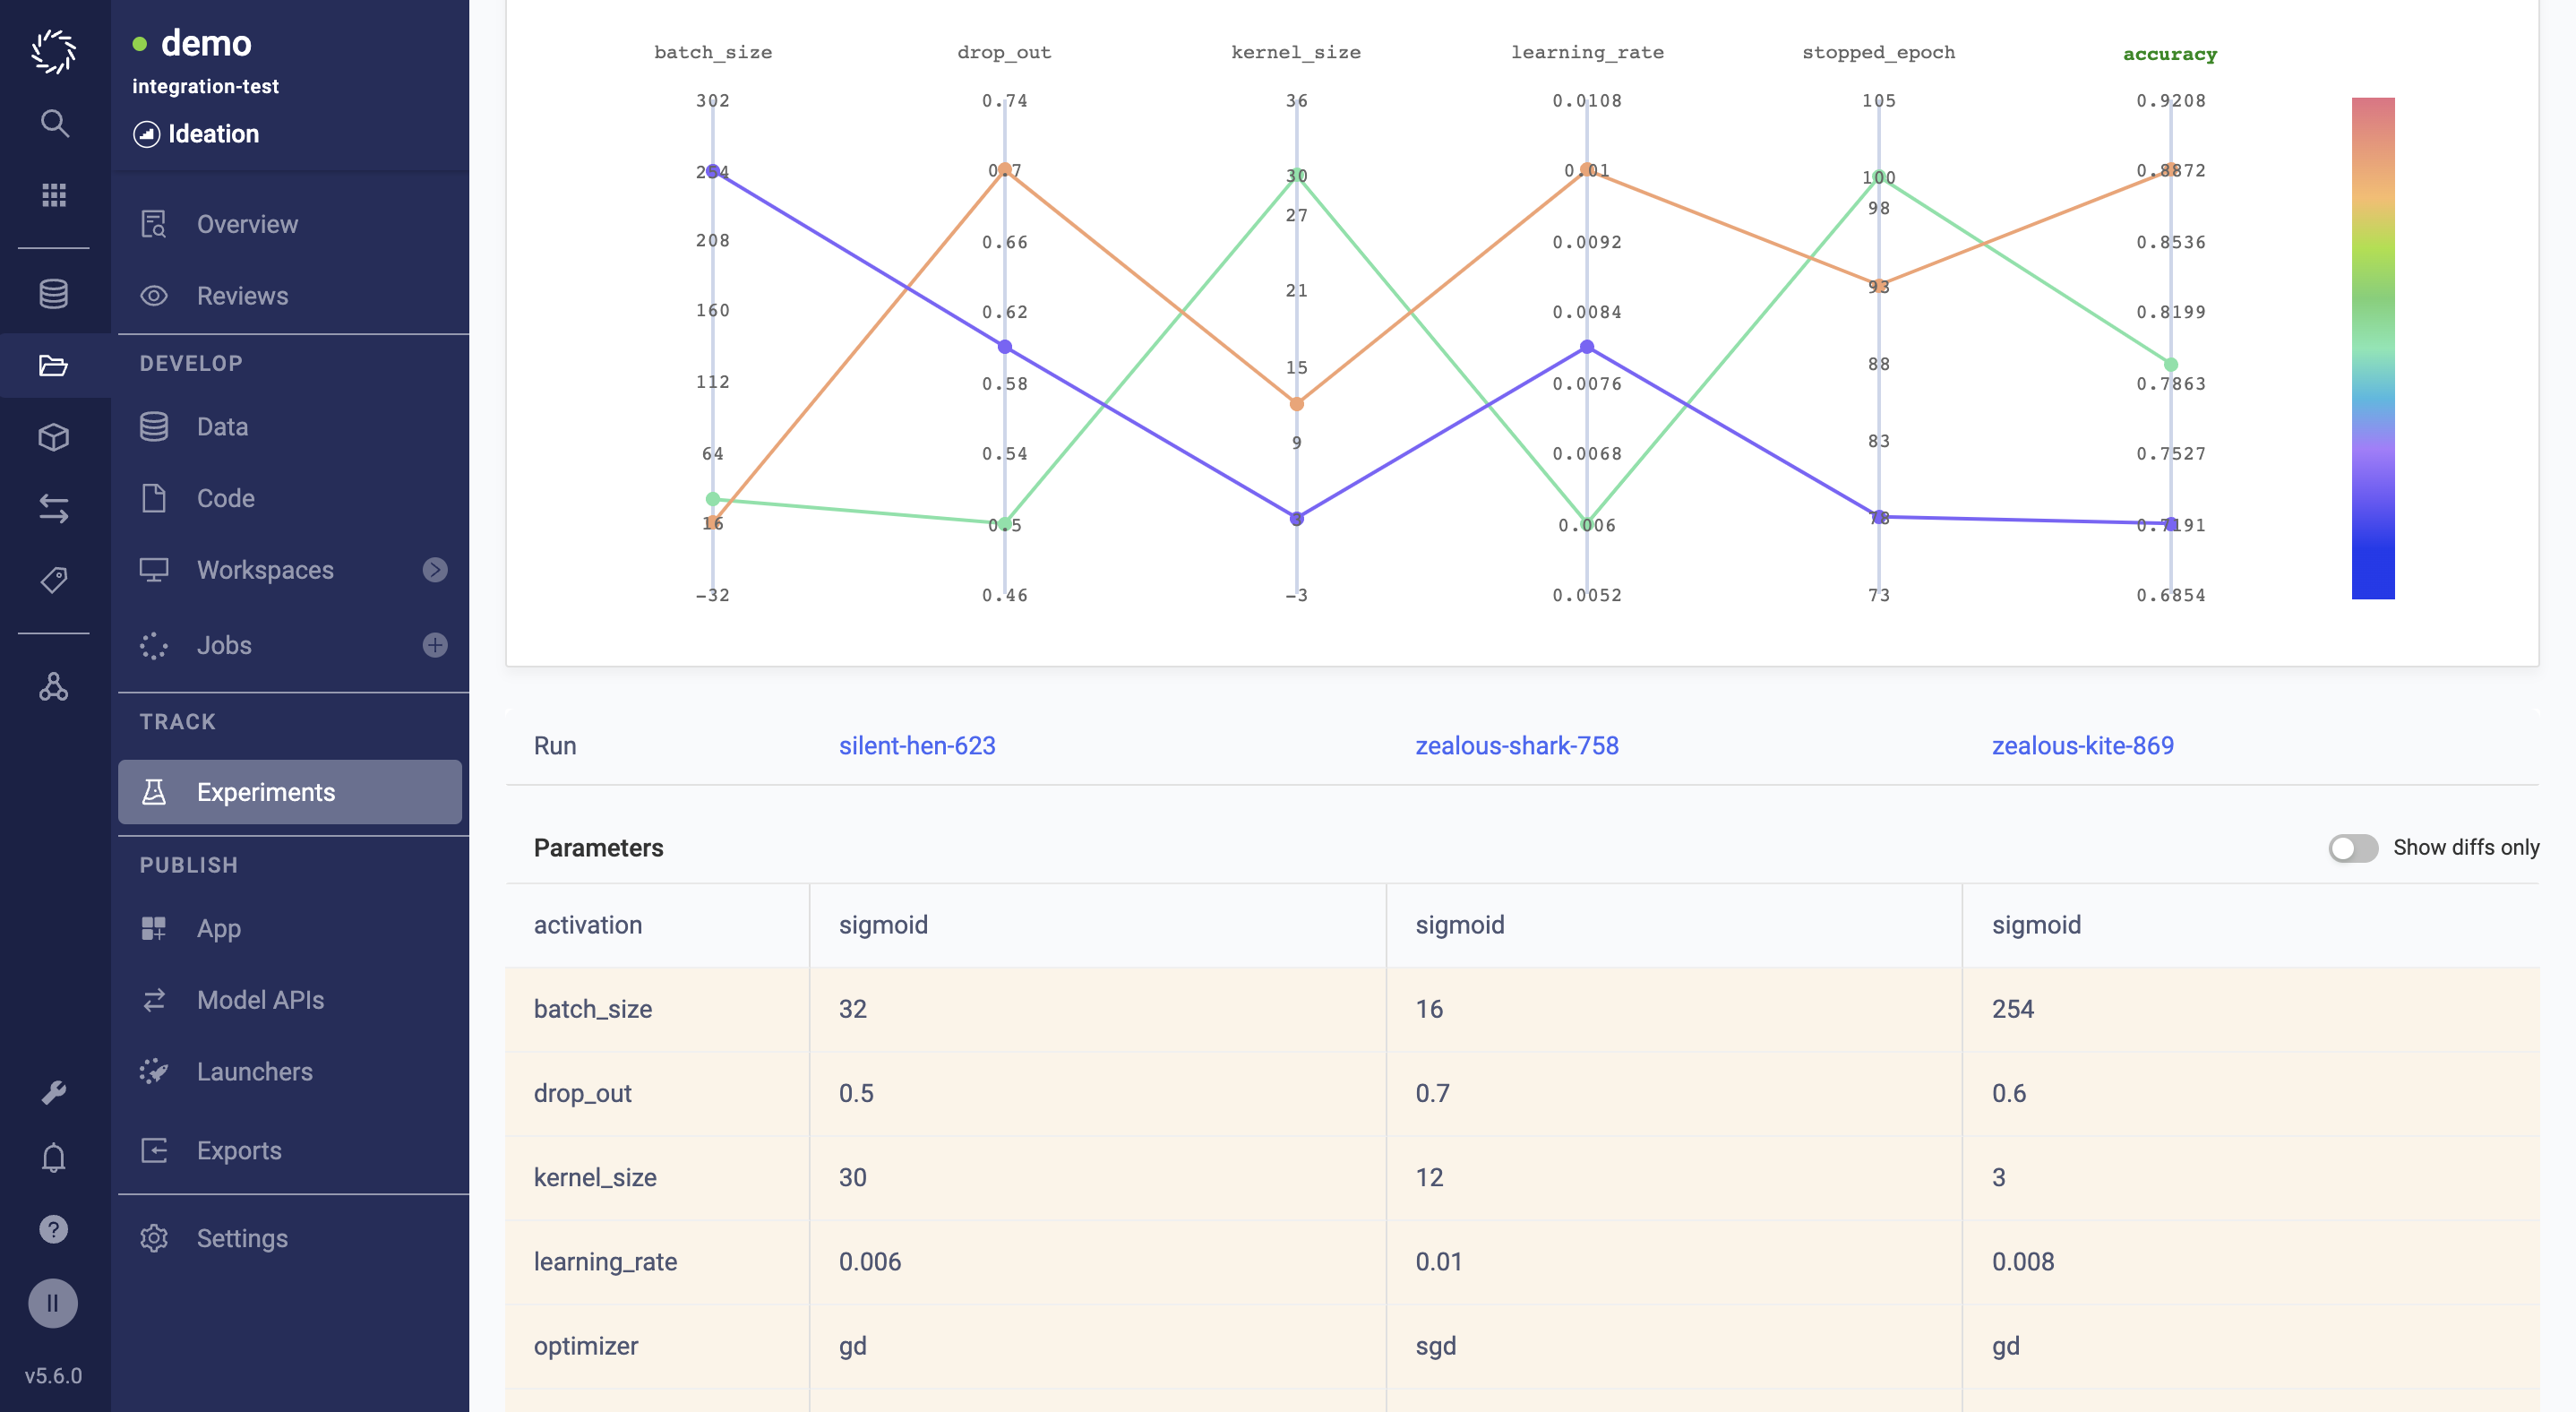
Select at least two trials from the main Experiments page and click the compare icon.
-
Use the side-by-side comparison to discover how different parameters impact accuracy and run time.
NoteWhen you change the Chart type to Line, you can also examine the time series charts for the metrics side-by-side. -
Click on a specific trial chart line.
-
Analyze differences captured in metadata: different compute environments, users, start times, and workspaces

Now that you know how to perform hyperparameter tuning in Domino, explore Track and Monitor Experiments or model deployment.
