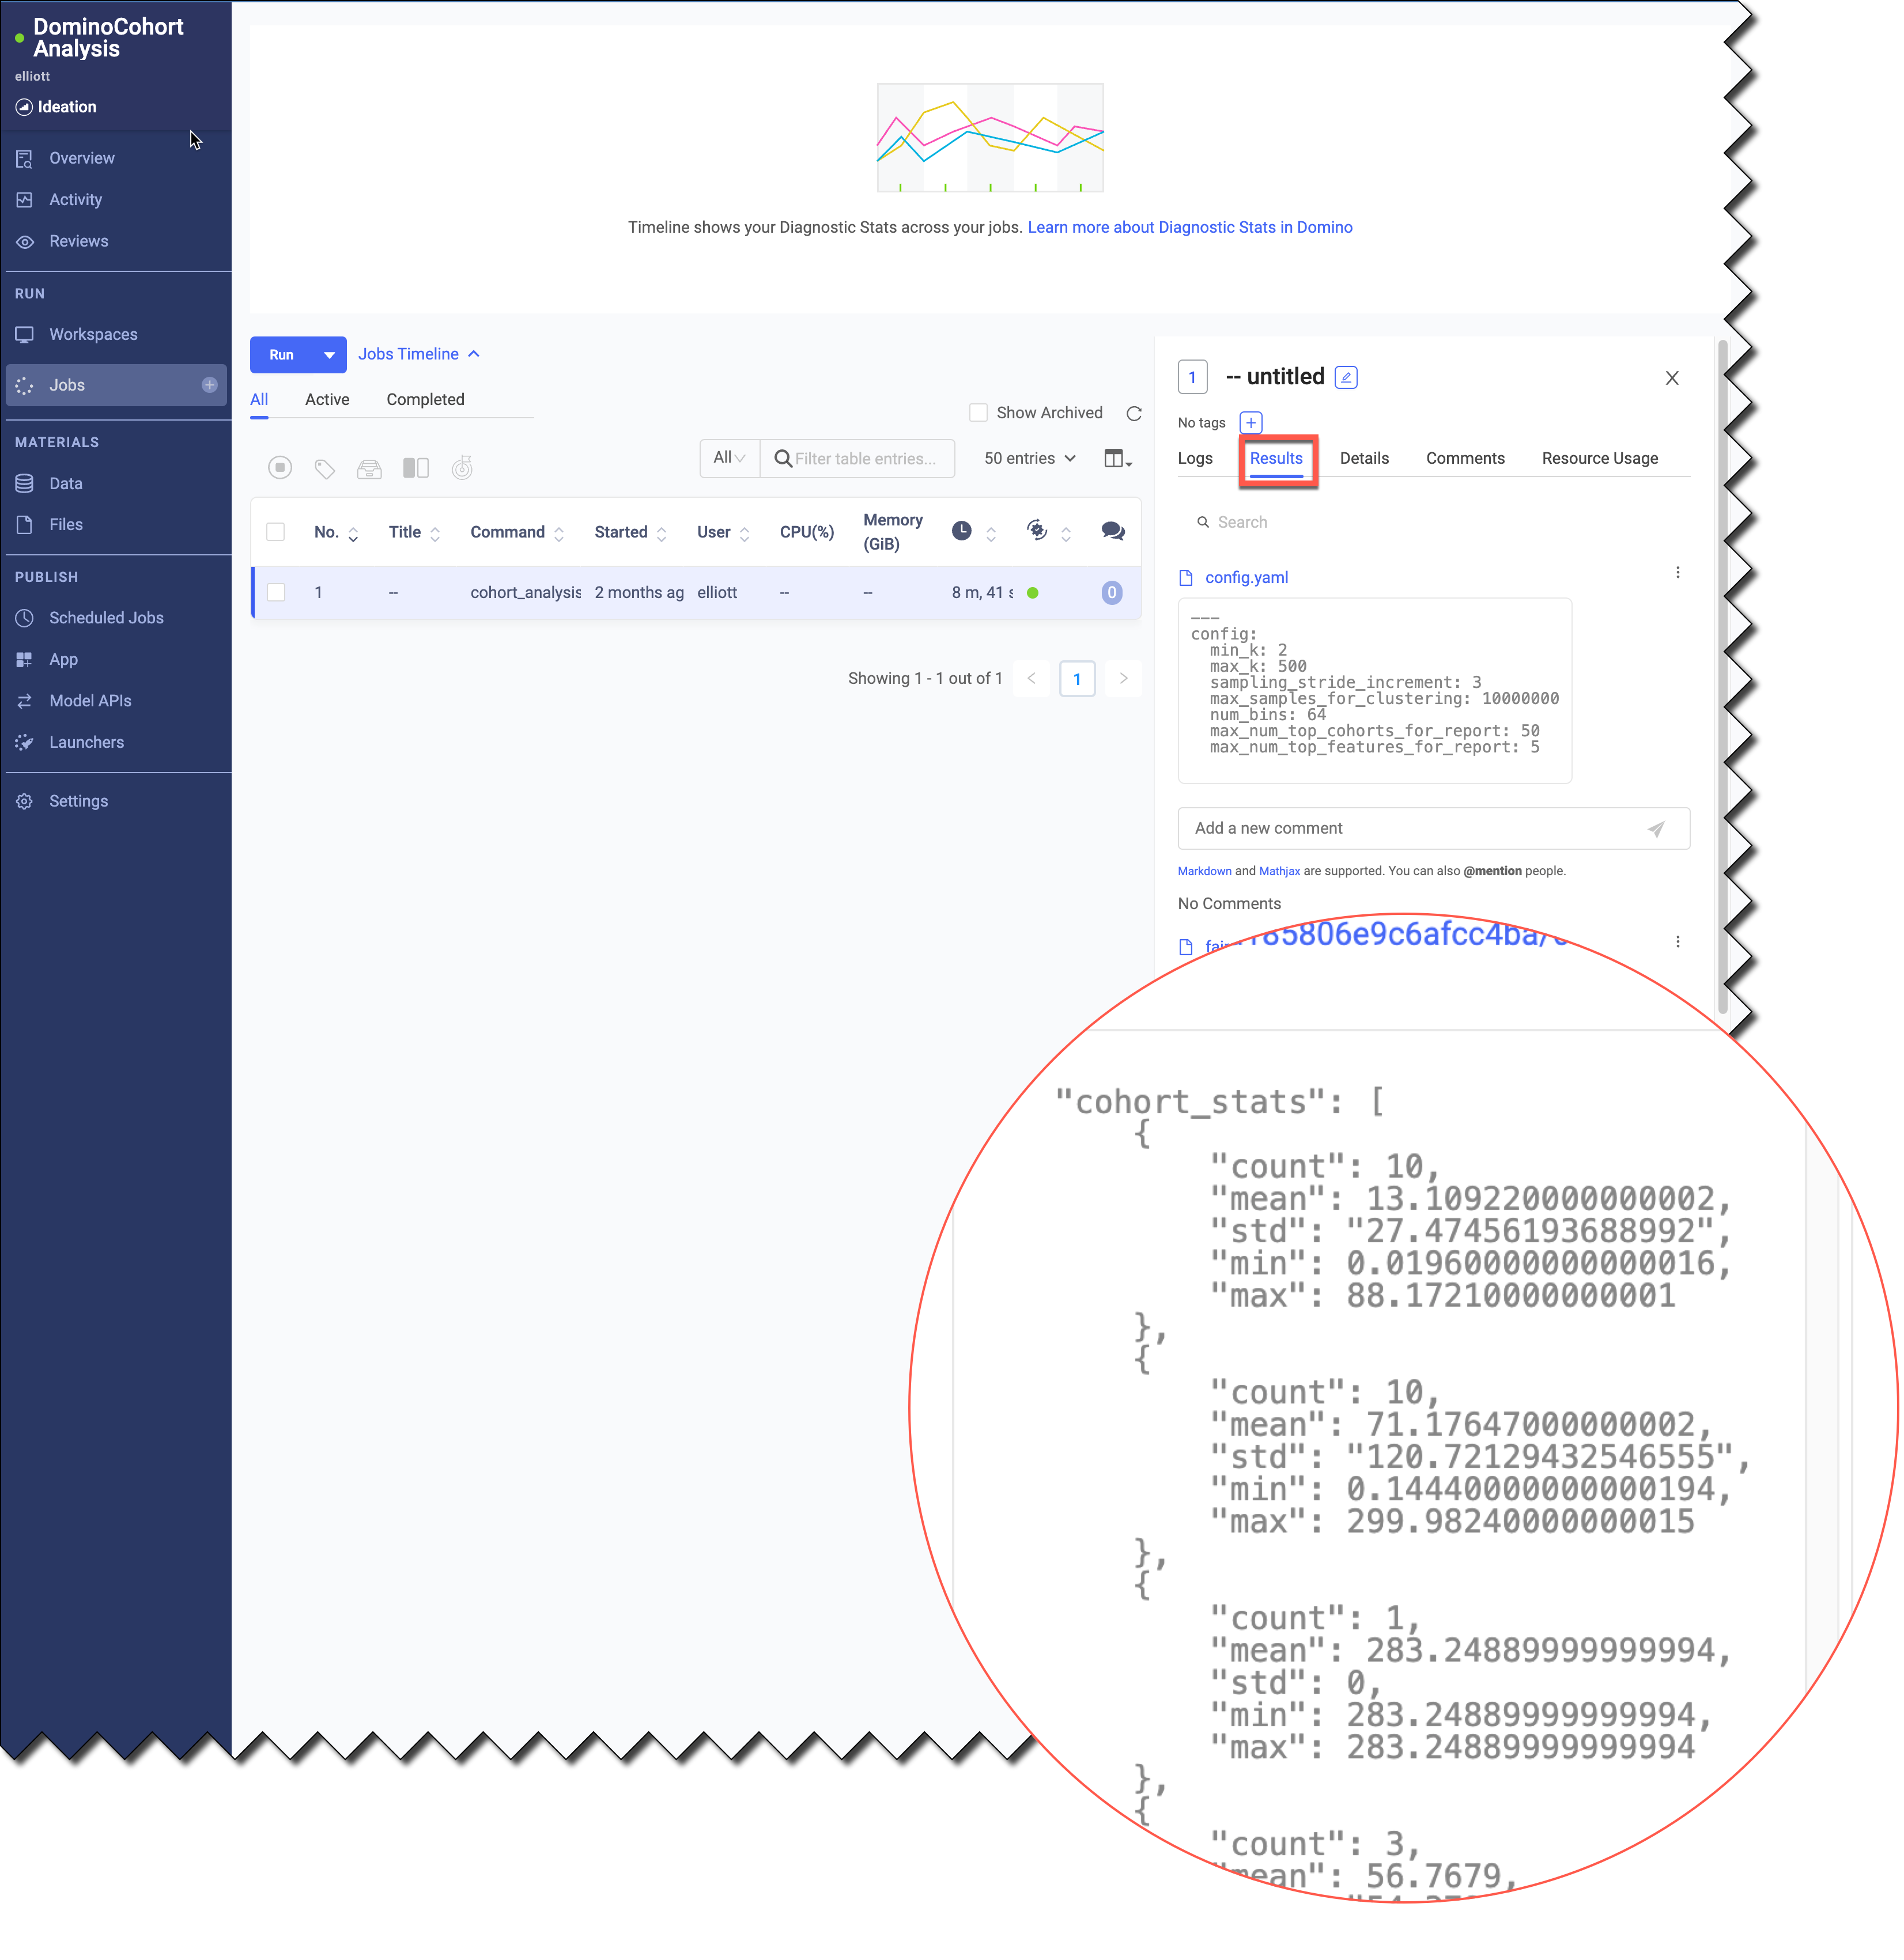
You can access the job or report for the Cohort Analysis from the Model Monitor.
-
The job gives you access to the JSON files that contain the code used to perform the analysis, as well as the cohort statistics. You can copy the code and statistics to create custom reports or to use when remediating your model.
-
The report shows a detailed cohort analysis. Use this to drill down into each cohort to understand the primary features that impact the model’s performance.
-
From the navigation pane, click Model Monitor.
-
Select the model for which you generated the Cohort Analysis.
-
Click Model Quality.
-
In the Cohort Analysis Report area, click one of the following:
-
Go to Job to see the job. Click the Results tab to see the JSON data that was used to generate the report. In the navigation pane, you can click Files to see the related files.

-
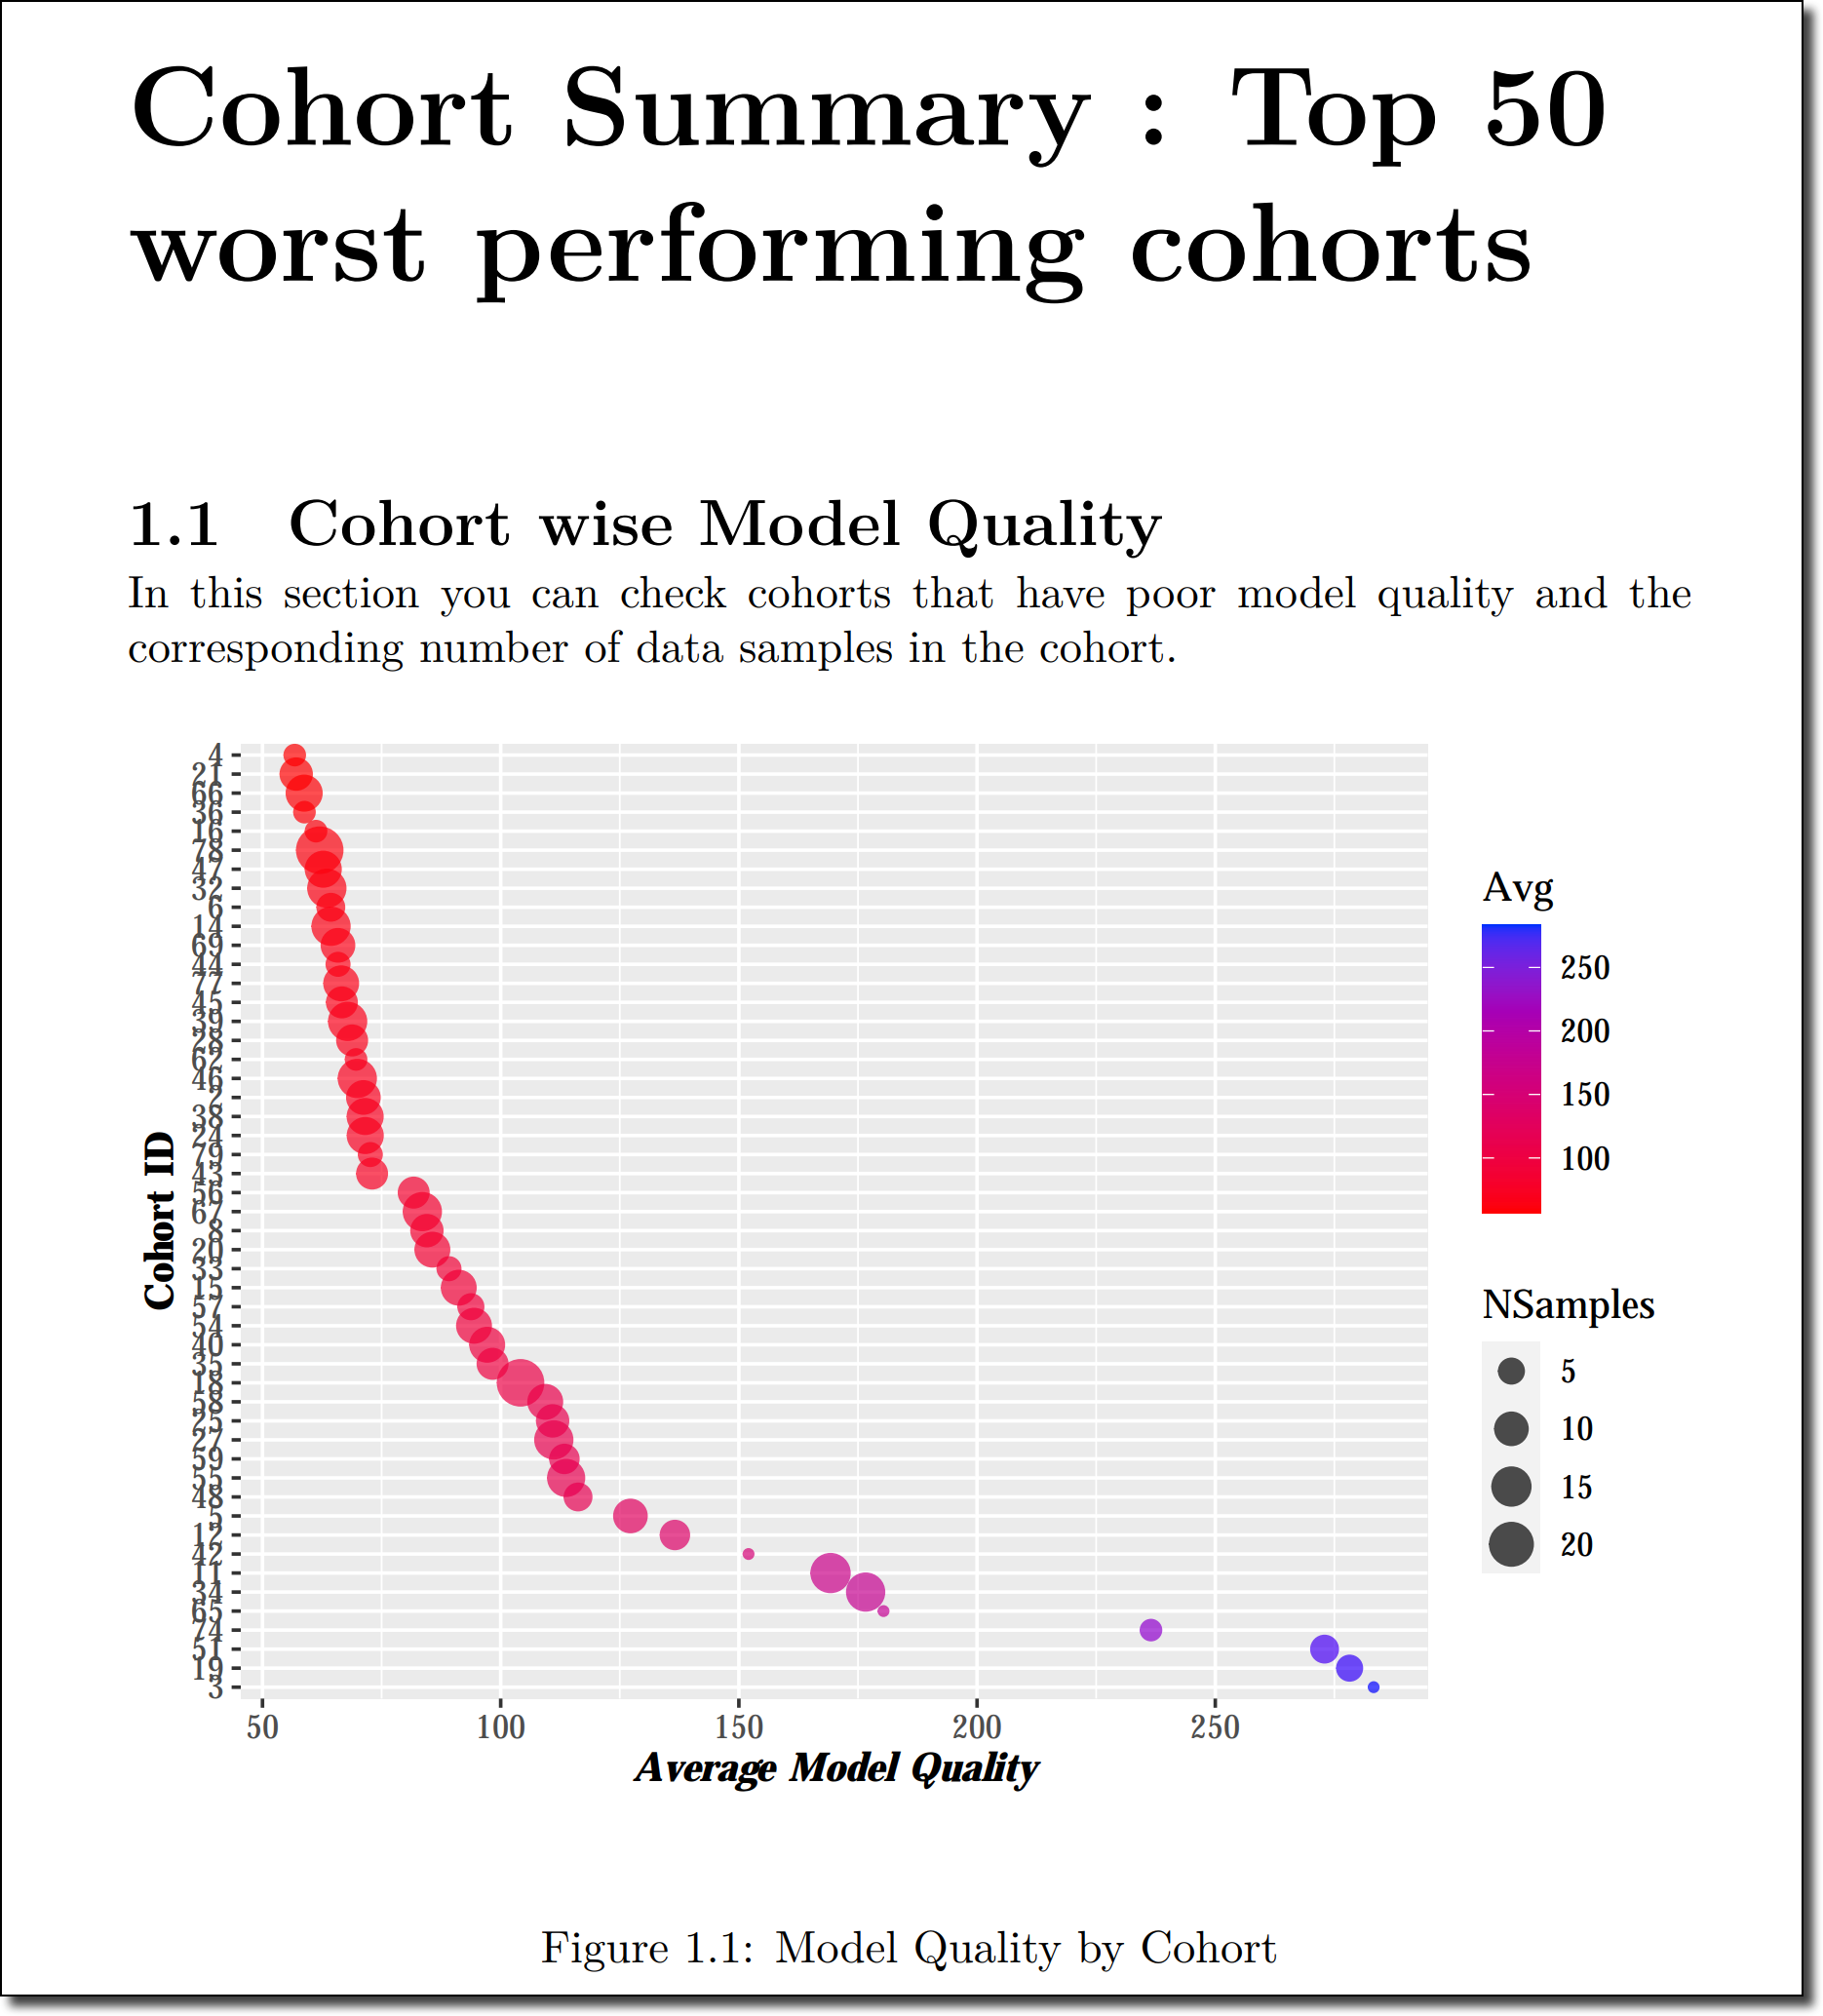
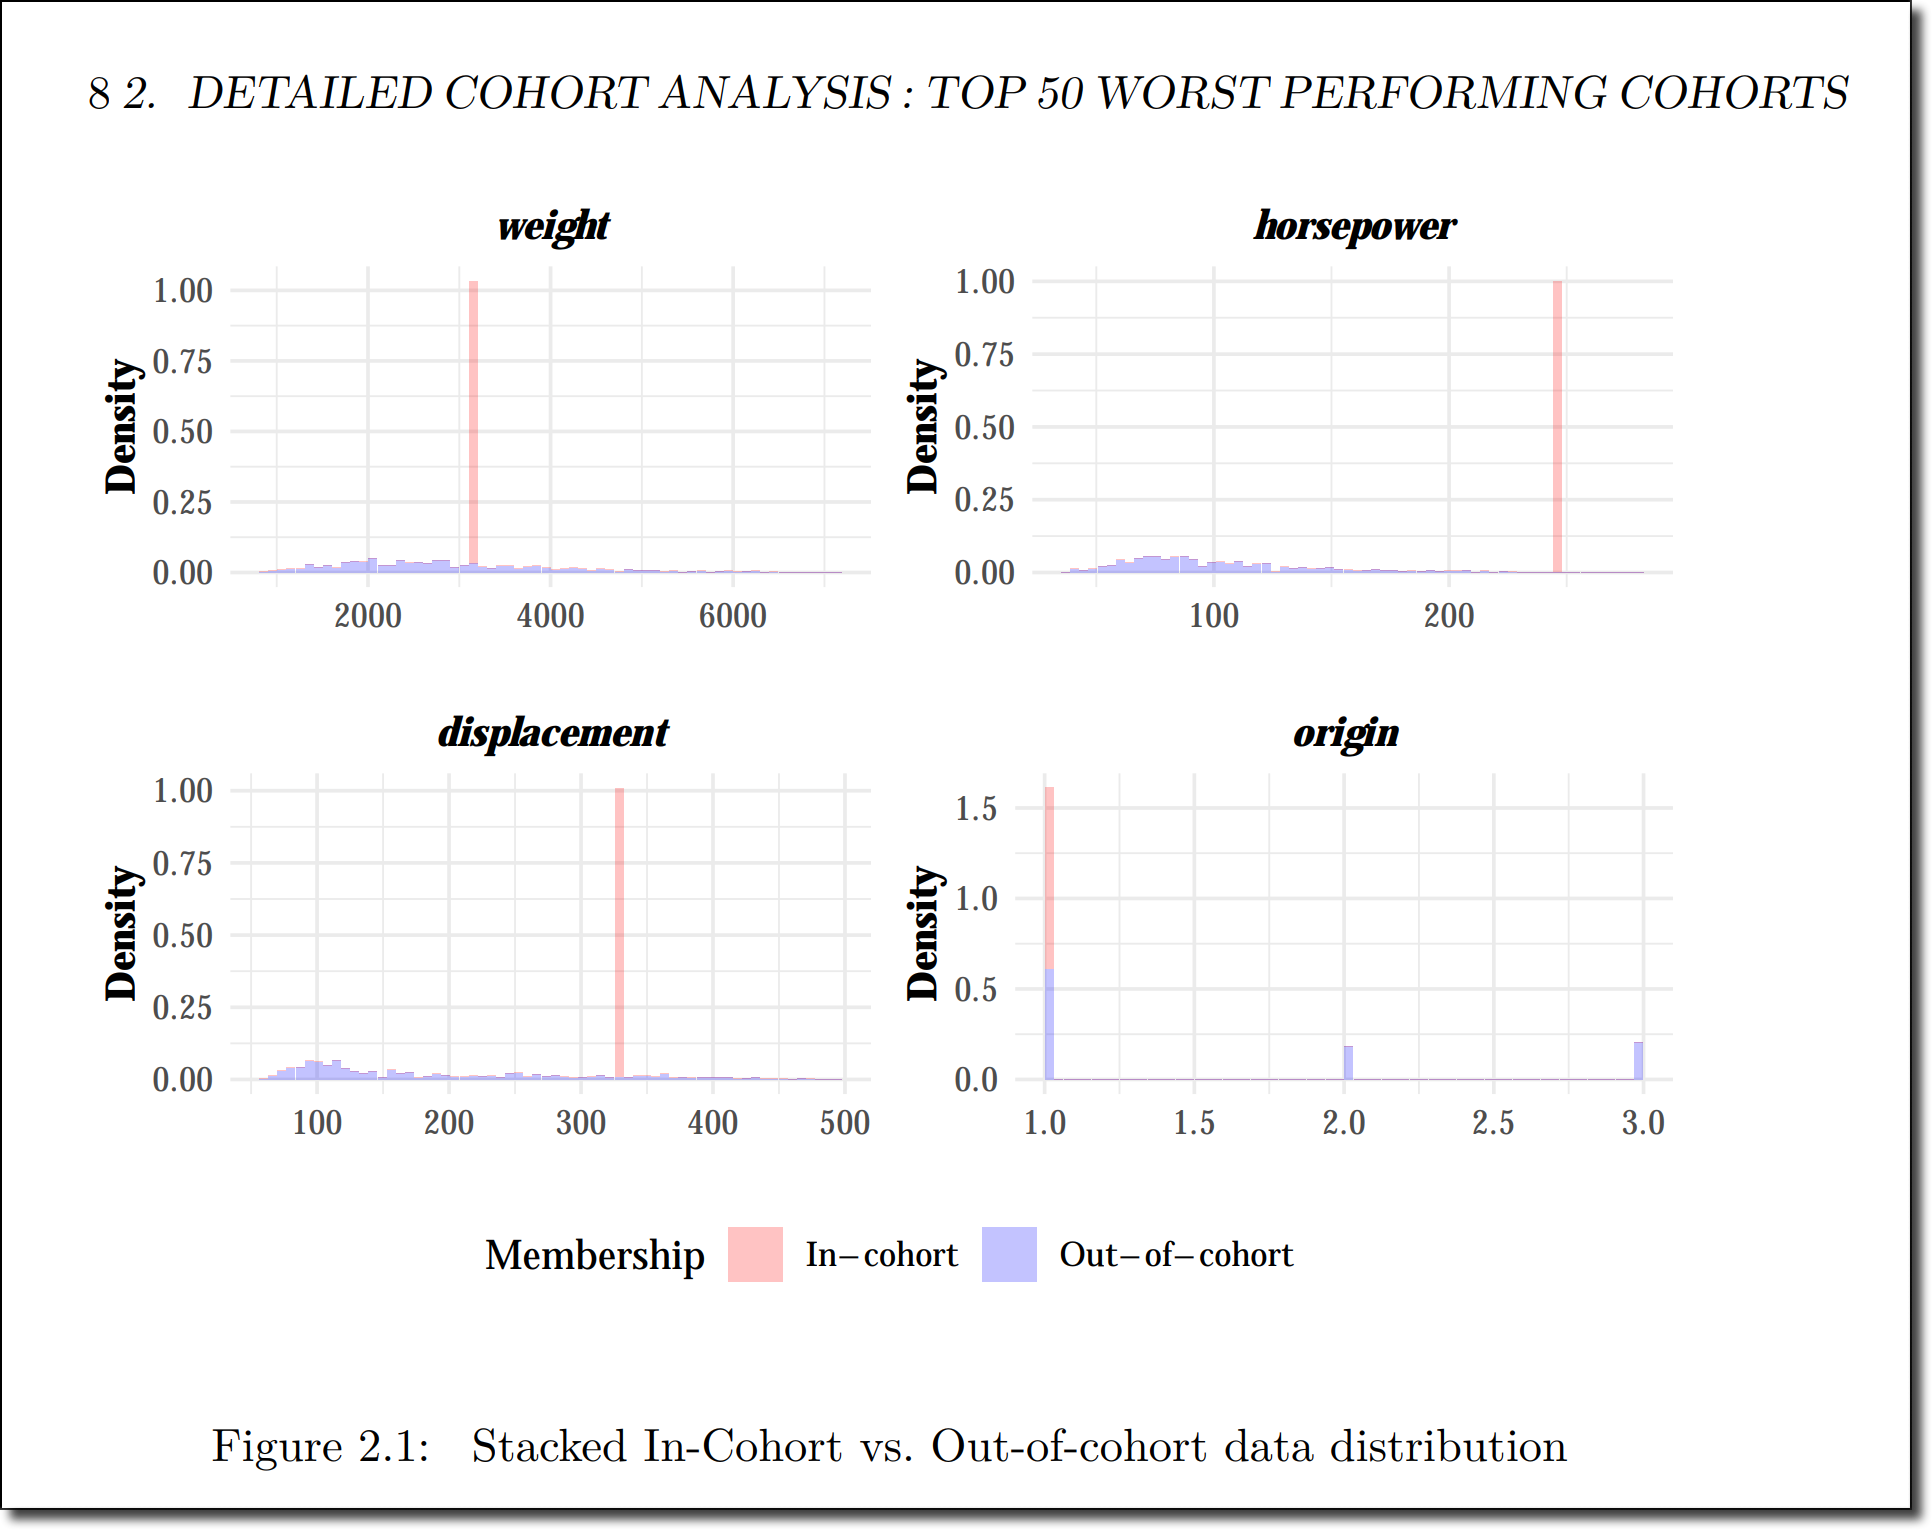
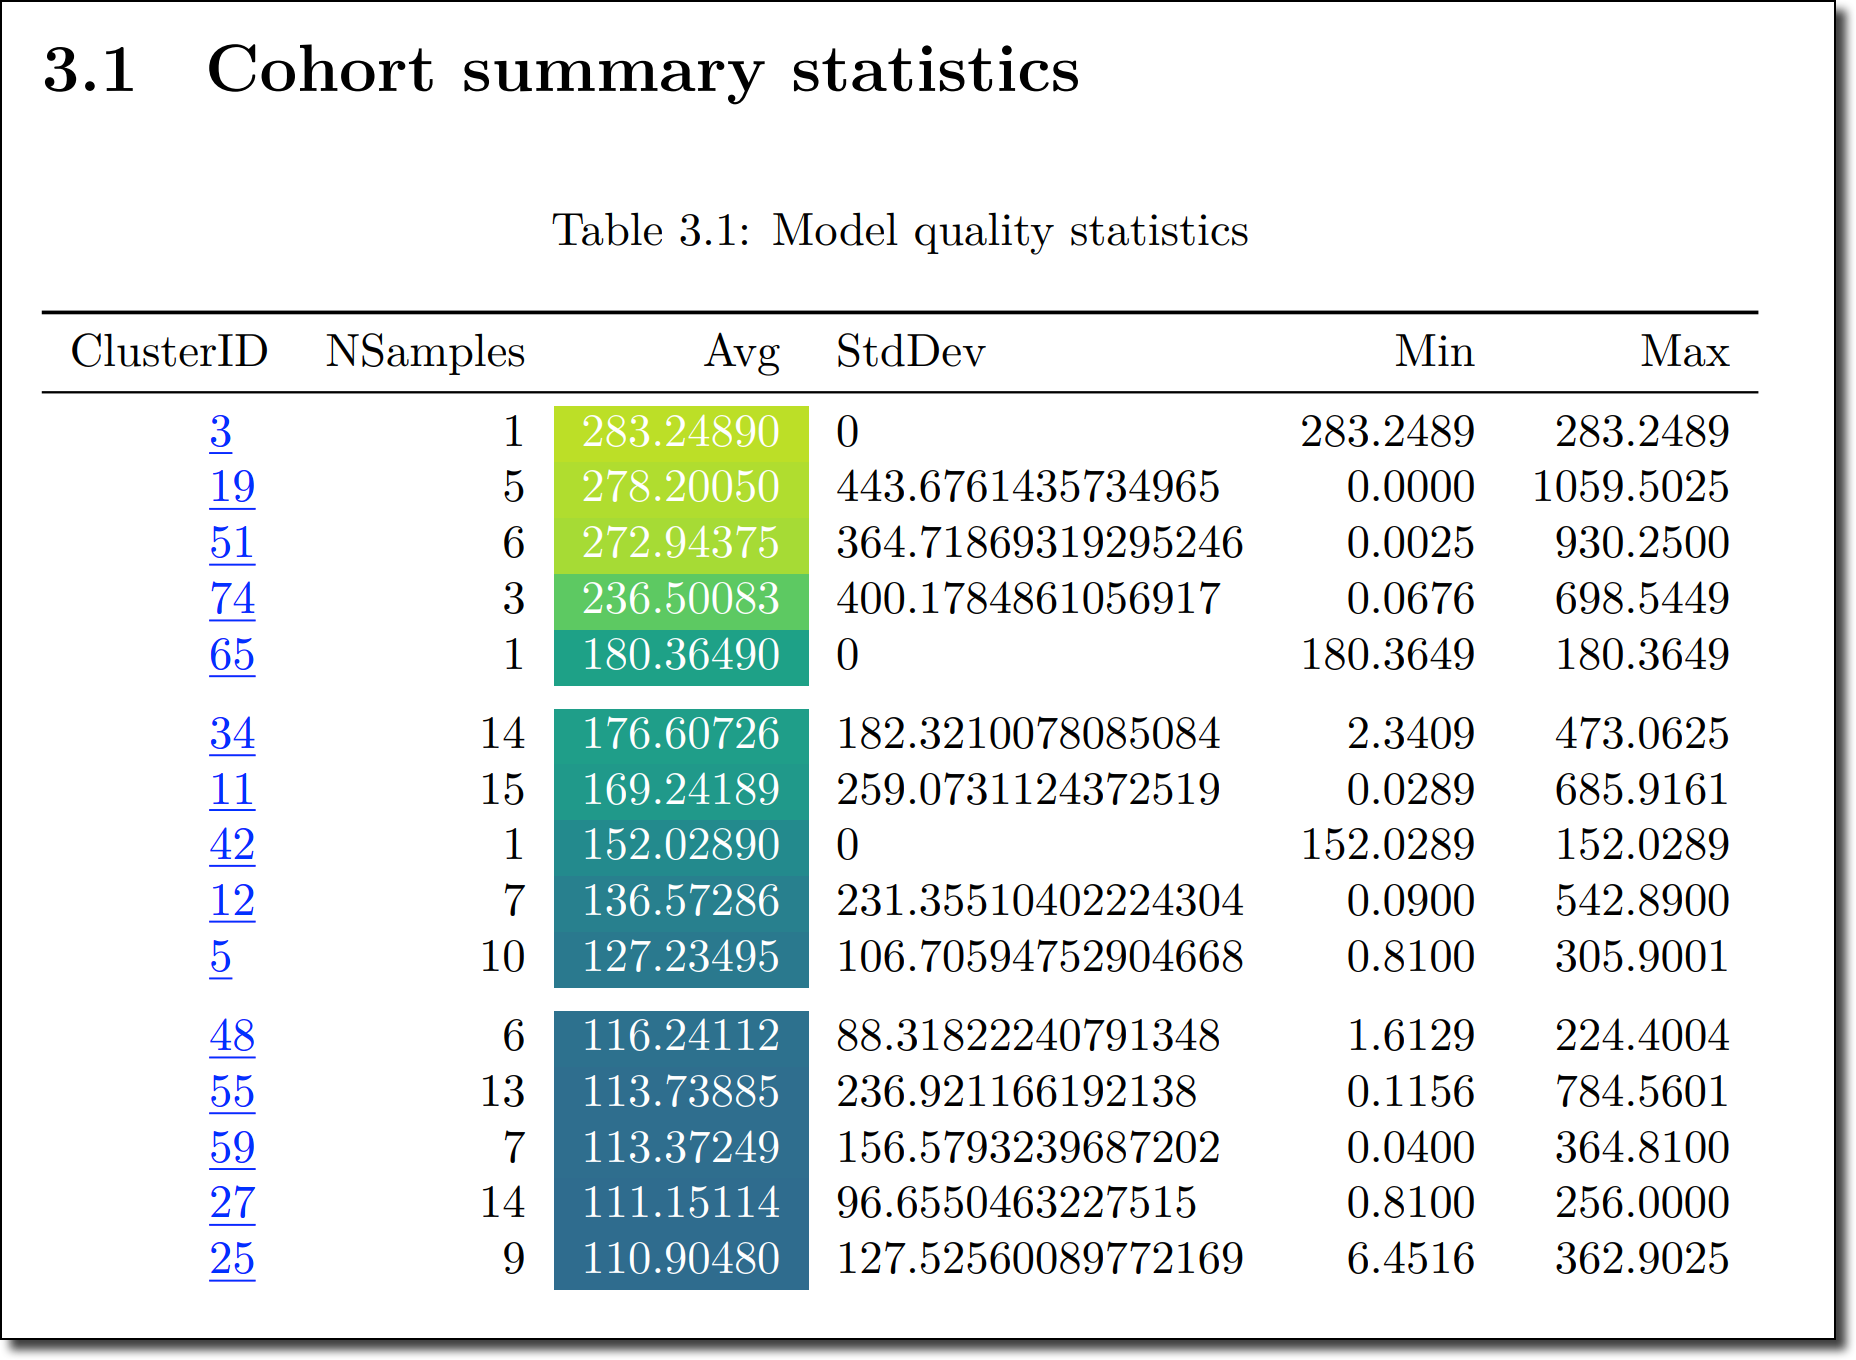
View Report to open a Files page that has the .pdf. Click
<filename>.pdfto view the report. The report has the following sections:-
Section 1 shows a visual representation and summary statistics about the model quality for the worst-performing cohorts. You can investigate these cohorts.
-
Section 2 shows information about the most distinctive features (quantified by a contrast score) for the top worst-performing cohorts. You can investigate a feature or a combination of features for remediation.
-
Section 3 shows summary statistics for all cohorts listed in the order of model performance. It also lists the features for a cohort that contribute to the cohort’s distinctiveness.


-
-
