This example shows you how to build a simple app using stock price data with Code Assist. You will: - Load demo stock data - Create an app that visualizes stock prices over time - Train a model to predict stock prices - Update the app to include the price prediction
The app allows you to interactively explore the stock prices for Apple (AAPL), Facebook (FB) and Google (GOOGL) over time.
Start by initialising Code Assist.
Load the stocks data, that is available as demo data in Code Assist.
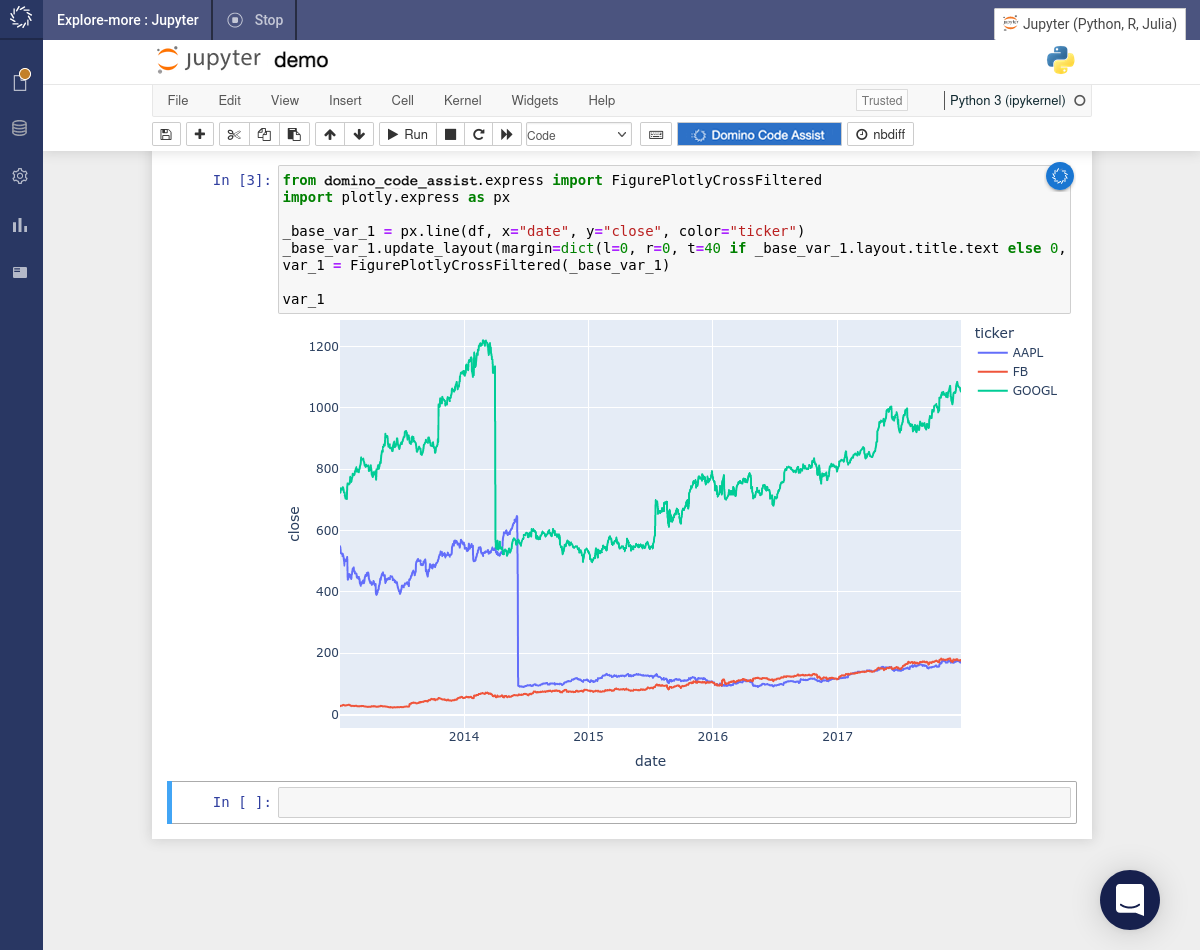
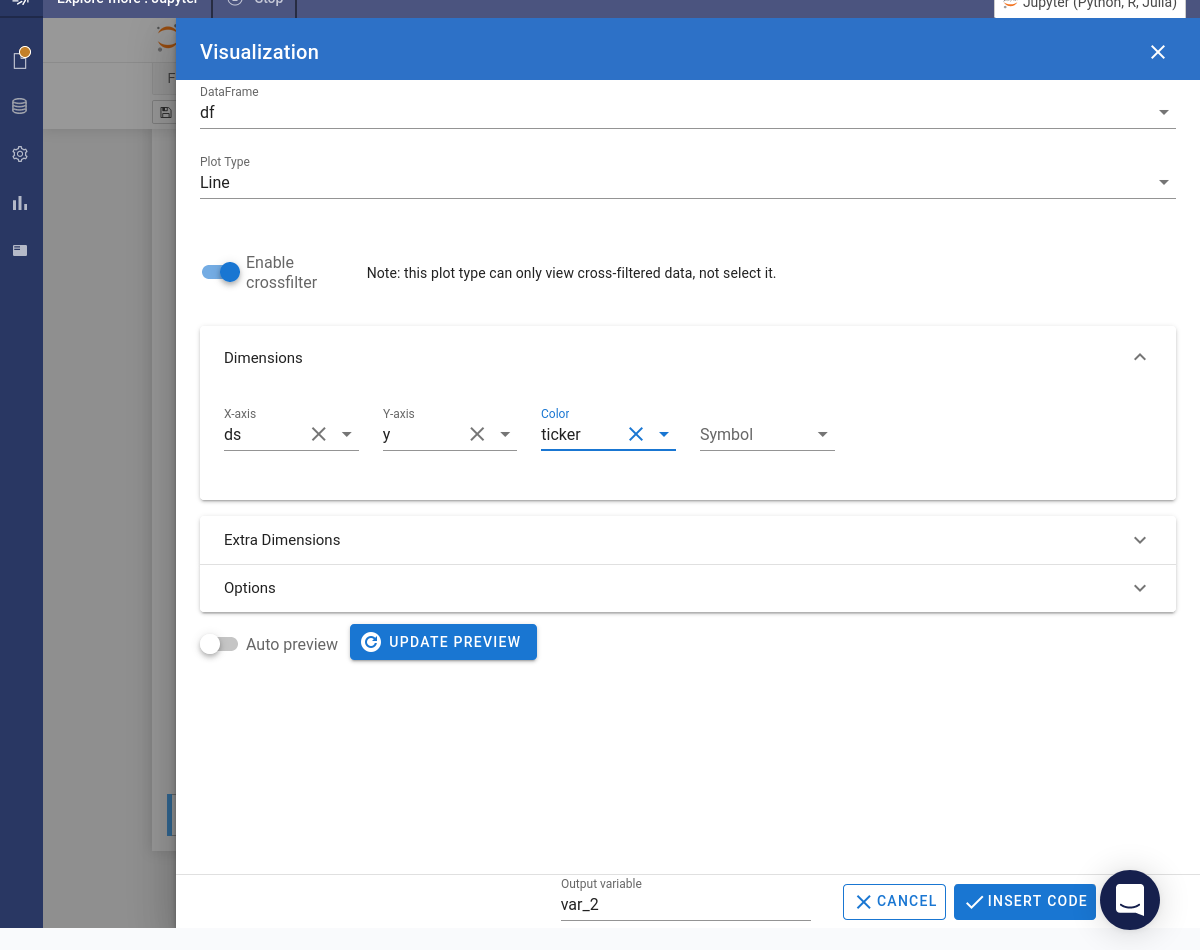
Use Code Assist to create a visualization. Enable the Enable crossfilter toggle to enable crossfilters on the visualization. Click the button.
The code is inserted into the notebook and immediately executed to create the visualization.
Add a crossfilter
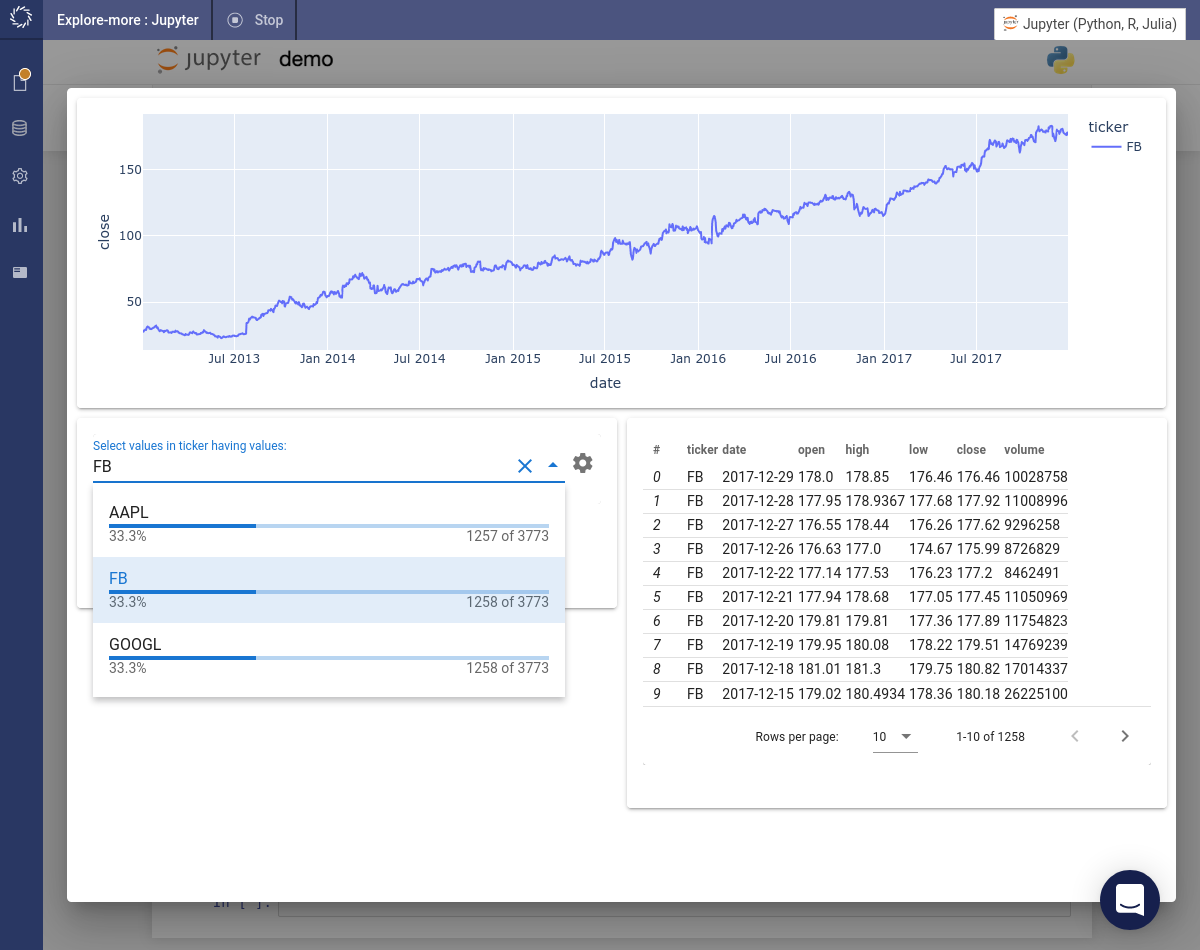
Use Code Assist to create a crossfilter. We’ll create a filter that allows us to select one or more ticker symbols. Flip the Multiple toggle to ensure that more than one option can be selected. Click the button.
Code is inserted into the notebook and immediately executed to create the crossfilter. Make various selections and observe the effect that they have on the visualization.-
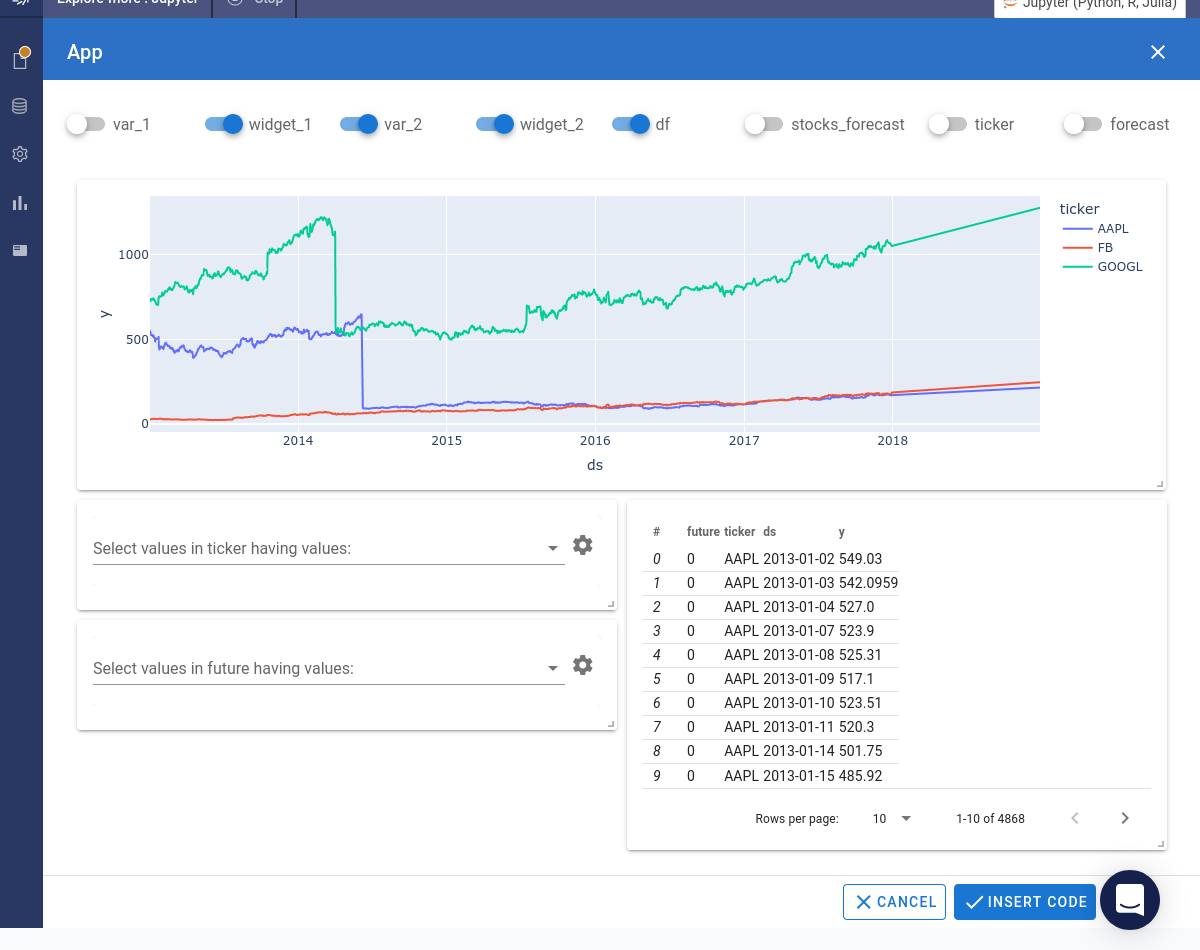
Use Code Assist to create an app. Select, move, and resize widgets until you have the required layout. Click the button.
-
Click the button to launch a preview of the app with all of the tickers selected by default.
-
Use the crossfilter to change the selected tickers. Observe the effect on the visualization and table.
-
Use the Prophet package to build a simple time series model for predicting future stock prices. First, run this command in a new cell in the notebook to install the package:
!pip install prophet -
Then import the package and reduce the level of logging as follows:
from prophet import Prophet import logging # logging.getLogger('prophet').setLevel(logging.WARNING) logging.getLogger('cmdstanpy').setLevel(logging.WARNING) -
Prepare the data for Prophet, which expects the time column to be called
dsand the value column to be calledy. Build a separate model for each ticker. Group the data byticker:df.rename(columns={"date": "ds", "close": "y"}, inplace=True) df = df[["ticker", "ds", "y"]].groupby('ticker') -
Insert this code into a new cell in the notebook. Create a function that builds a model and generates predictions for a single ticker. Then apply that function to all of the tickers. The results are stored in a list of
DataFrameobjects.
def train_and_forecast(ticker):
  m = Prophet(yearly_seasonality=False, weekly_seasonality=False)

  m.fit(ticker)
  future = m.make_future_dataframe(periods=365, include_history=False)
  forecast = m.predict(future)[['ds', 'yhat']]
  forecast['ticker'] = ticker['ticker'].iloc[0]

  return forecast[['ticker', 'ds', 'yhat']]

stocks_forecast = []

for ticker in ['AAPL', 'FB', 'GOOGL']:
    ticker = df.get_group(ticker)
    forecast = train_and_forecast(ticker)
    stocks_forecast.append(forecast)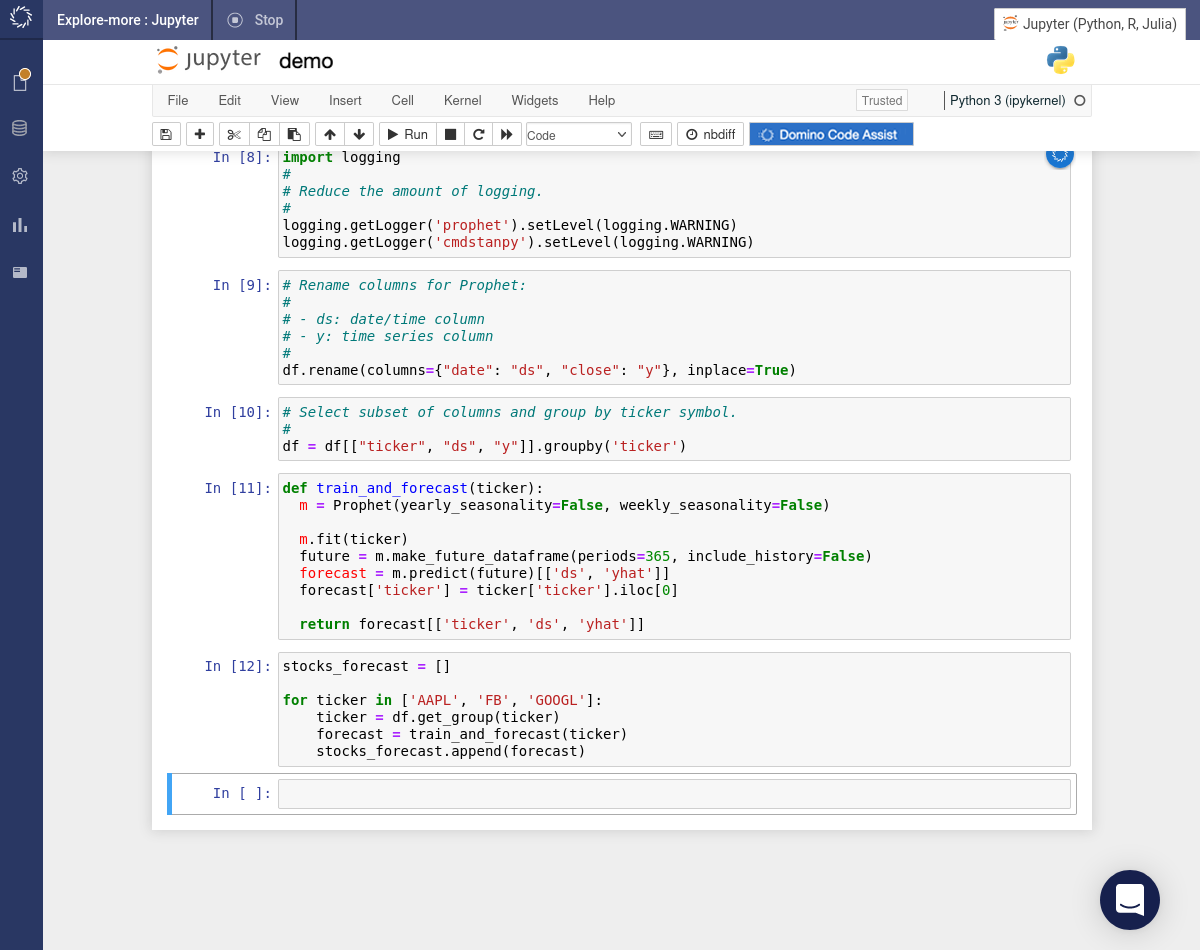
-
Insert the following code to concatenate the predictions for all of the tickers and add a
futurecolumn, which indicates that these are predictions.stocks_forecast = pd.concat(stocks_forecast) stocks_forecast.rename(columns={"yhat": "y"}, inplace=True) stocks_forecast.insert(0, "future", 1) stocks_forecast.loc[:,"ds"] = stocks_forecast["ds"].dt.strftime('%Y-%m-%d') -
Use the
head()method to check on the data.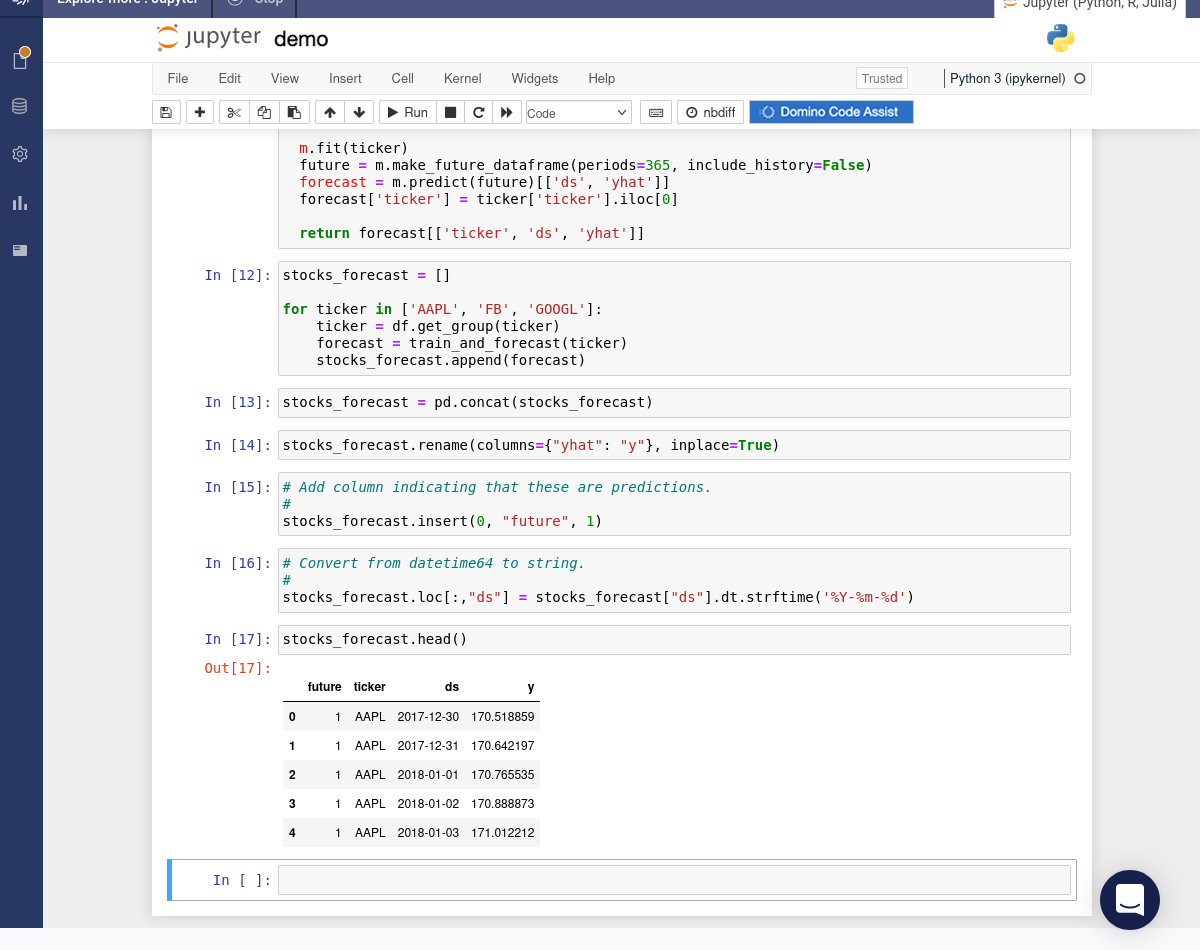
-
Prepare the original data with a consistent format and then concatenate the original data and predictions:
df = df[["ticker", "ds", "y"]]

df = df.obj
df.insert(0, "future", 0)

df = pd.concat([df, stocks_forecast])

df = df.sort_values(by=["ticker", "ds"])-
Create a new visualization.
-
Create a crossfilter widget to select values from the
futurecolumn.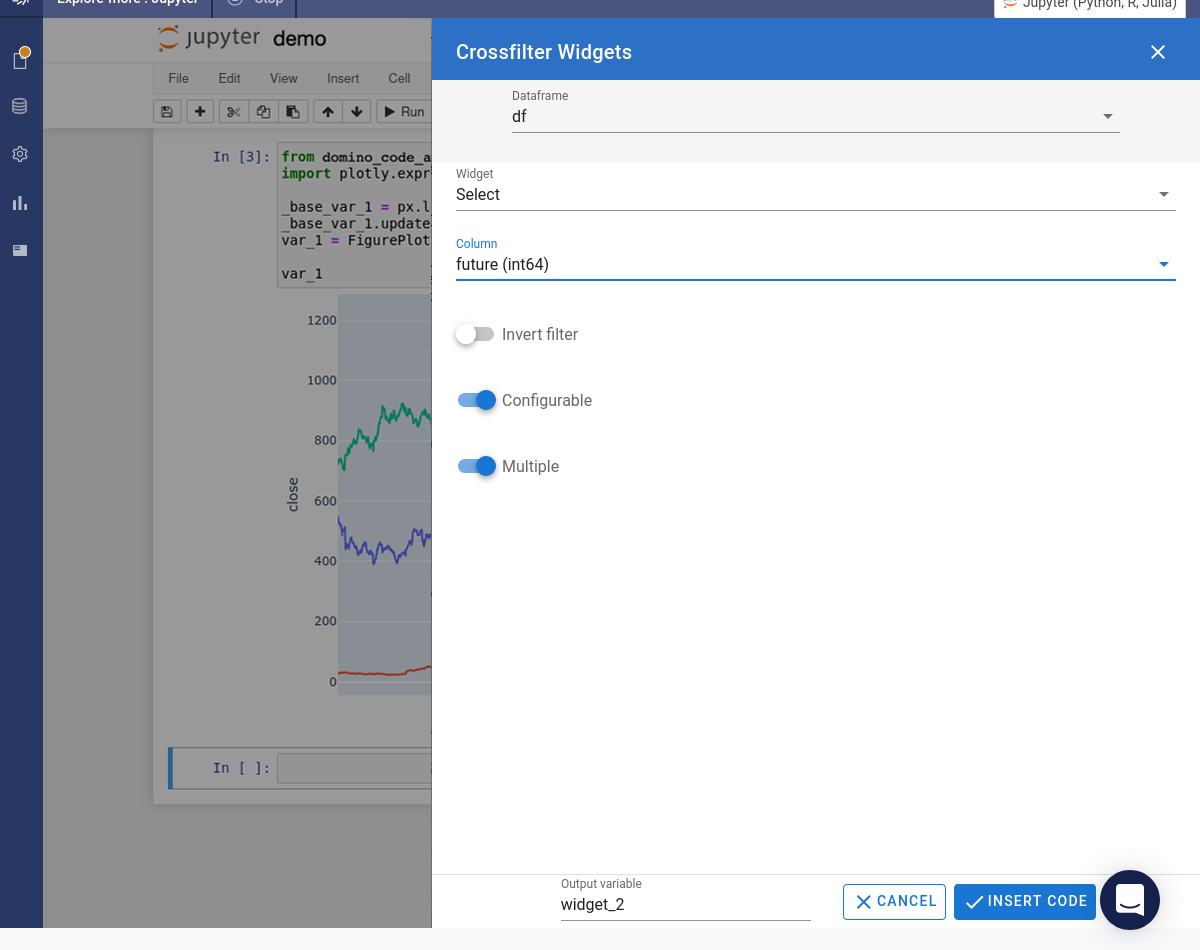
-
Create an app that includes the new visualization, a data table, and both crossfilter widgets.
-
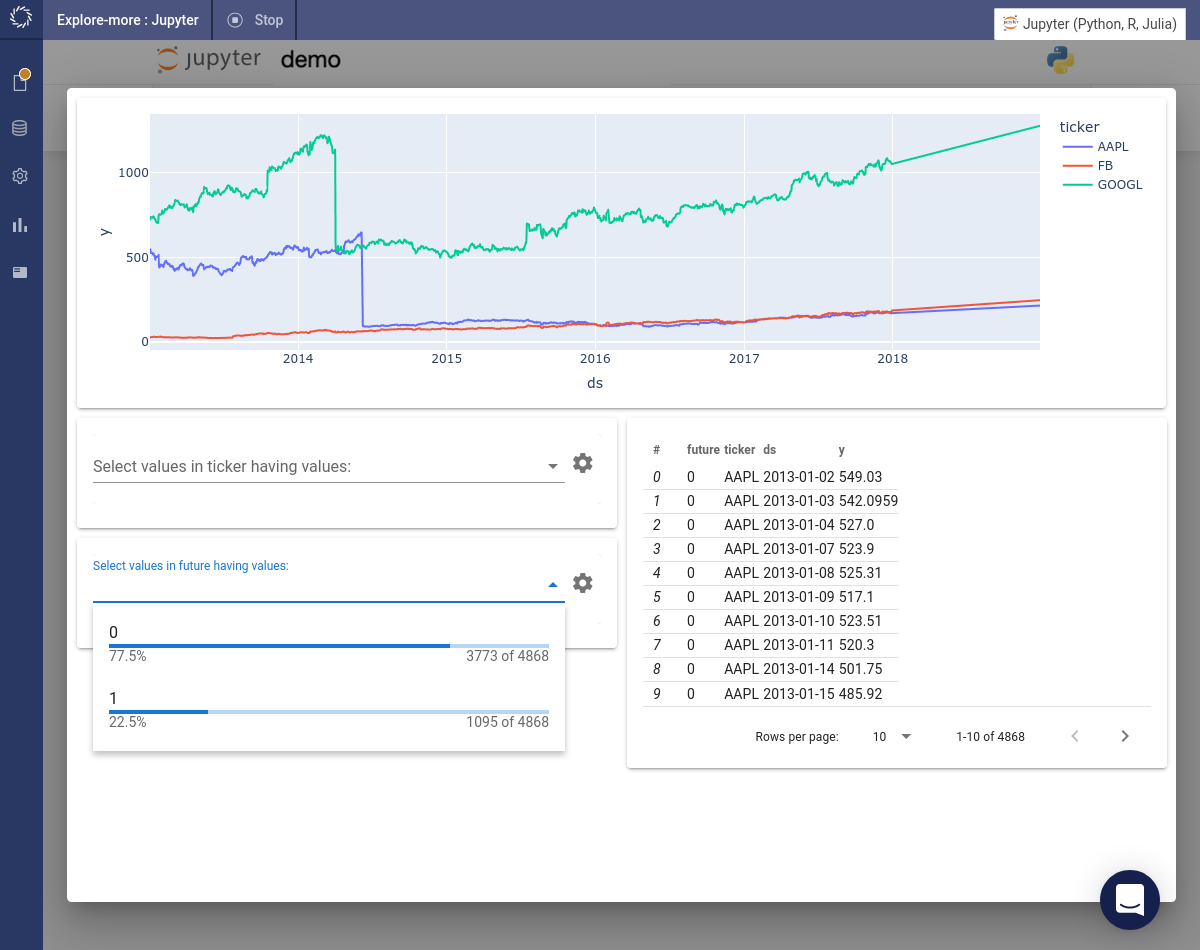
Preview the app. Use the filter on
futureto choose whether to plot the original data, predictions, or both.
Learn how to embed an app in a Tableau dashboard.