Learn how to build an app with Code Assist to interactively explore drug classification data. In this example you will:
-
Load CSV data
-
Create a visualization app
-
Train a classification model
Start by initializing Code Assist.
Download the drug classification data from Kaggle. Use Code Assist to load CSV data. The data should have the following columns:
-
Age -
Sex -
BP(blood pressure) -
Cholesterol -
Na_to_K(ratio of Sodium to Potassium) and -
Drug(drug label).
-
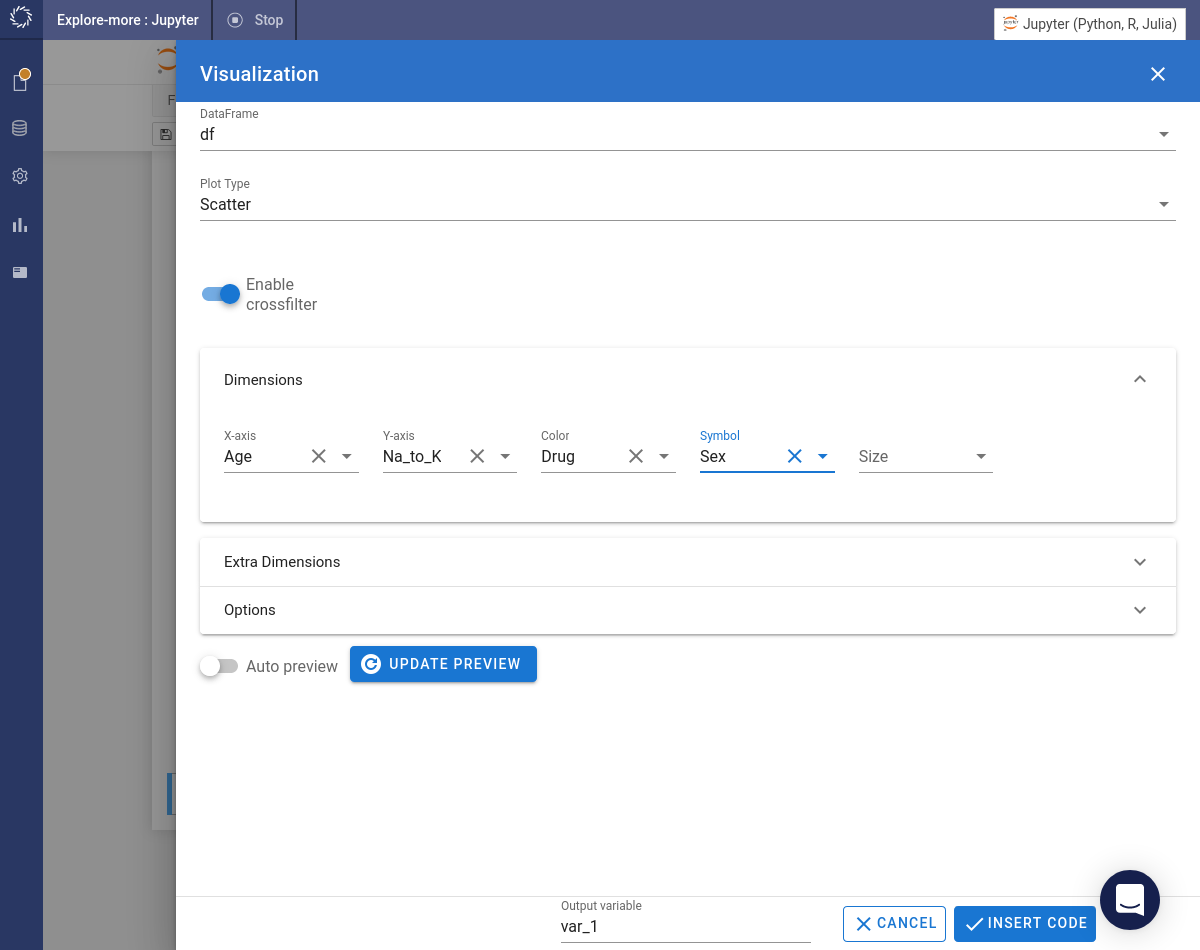
Use Code Assist to create a crossfilter to select one or more drug classes. Enable the Multiple toggle to select more than one drug class. Click the button.
-
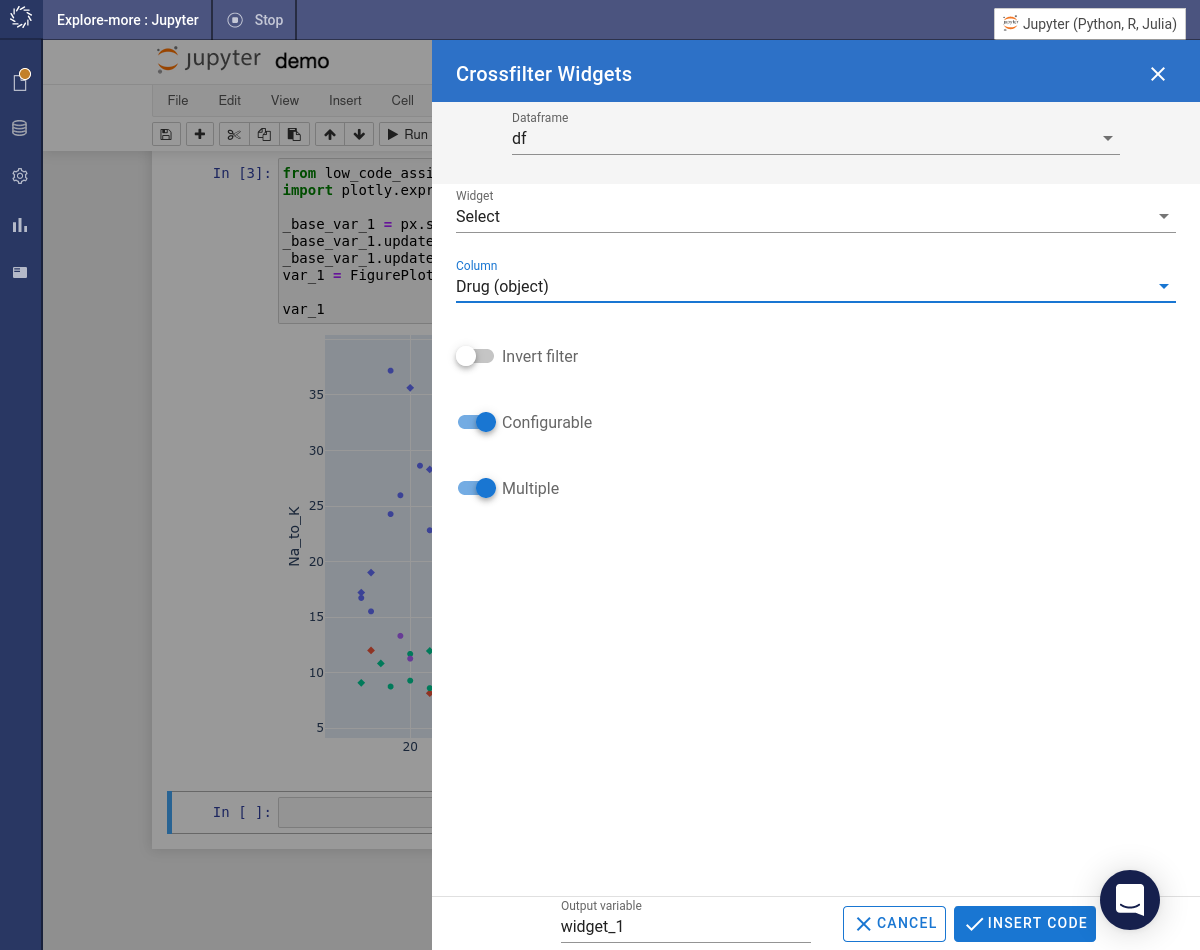
Create a second crossfilter. This time choose a Slider filter and select the
Na_to_Kcolumn. Change the Mode to>=. Click the button. -
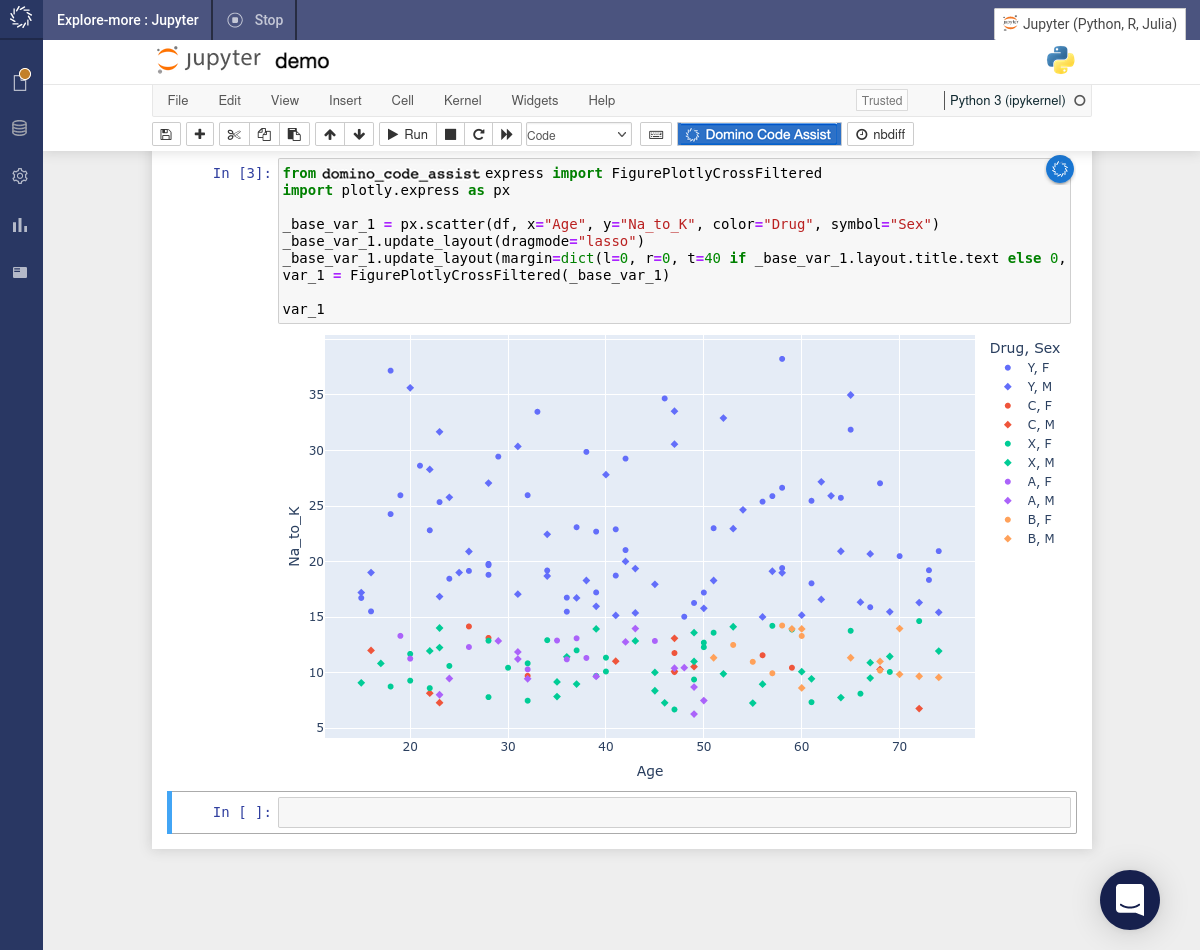
The code for both of the crossfilters will be present in the notebook. Use the crossfilters to change the appearance of the visualization.
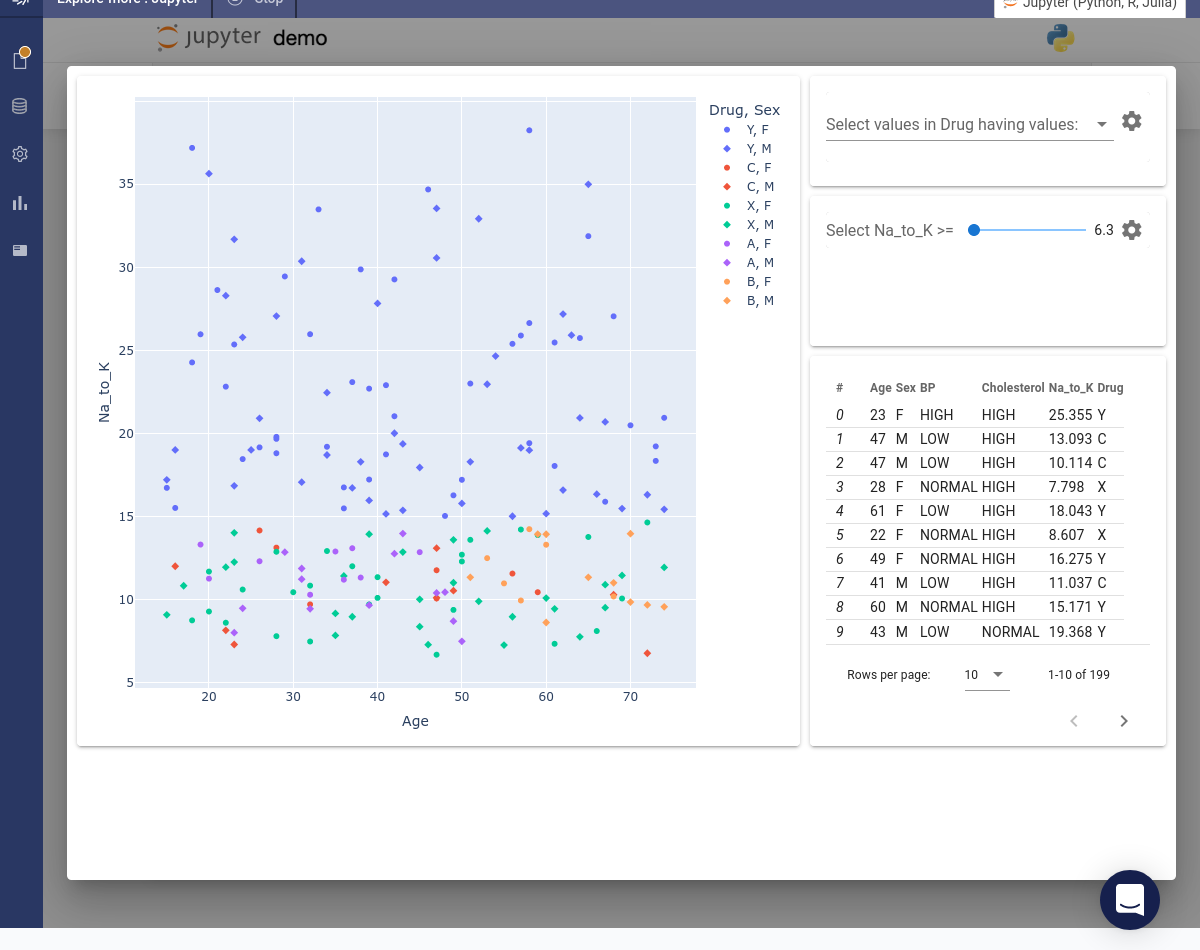
-
Use the same data to build a simple Machine Learning model to predict the drug class. First let’s take another look at the data in
df.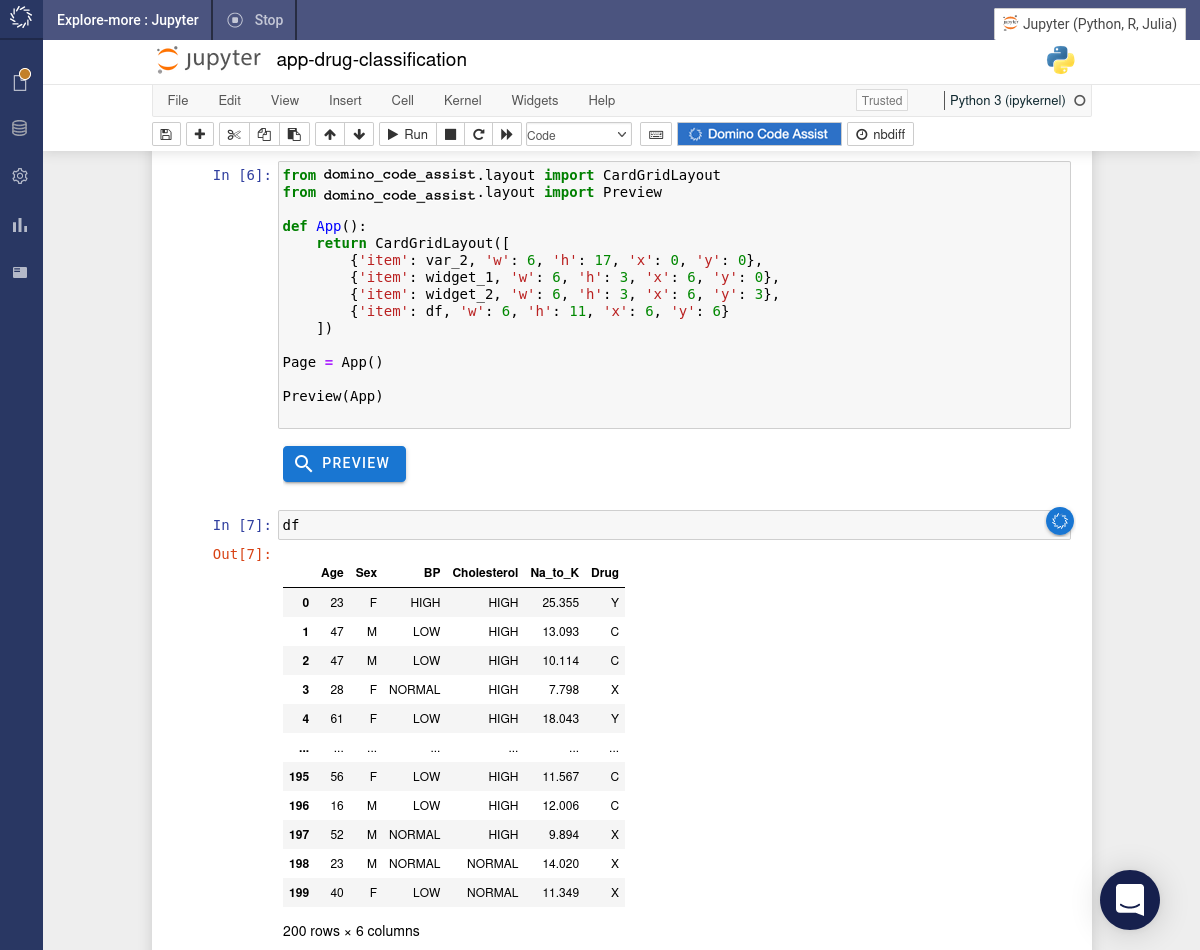
-
Create a model to predict
Drugusing the remaining columns. You need to import some more packages and then split the data in predictors,X, and target,y. Insert the following code into a new cell in the notebook.from sklearn.tree import DecisionTreeClassifier from sklearn.metrics import confusion_matrix from sklearn.model_selection import train_test_split from sklearn.preprocessing import LabelEncoder X = df.iloc[:,:5] y = df.iloc[:,5] -
The categorical columns,
Sex,BPandCholesterolneed to be dummy (one-hot) encoded. Insert the following code into a new cell in the notebook.sex = pd.get_dummies(X['Sex']) bp = pd.get_dummies(X['BP']) cholesterol = pd.get_dummies(X['Cholesterol']) X = pd.concat([X[['Age']], sex, bp, cholesterol], axis='columns') -
The target column,
y, also needs to be encoded. Insert the following code into a new cell in the notebook.encoder = LabelEncoder() y = encoder.fit_transform(y) -
Now split the data into training and testing sets then build a model using the training set. Insert the following code into a new cell in the notebook.
X_train, X_test, y_train, y_test = train_test_split(X, y, random_state = 0)

tree = DecisionTreeClassifier(max_depth = 2).fit(X_train, y_train)
Finally, use the model to make predictions for the testing set and then calculate the model accuracy on the testing set. Insert the following code into a new cell in the notebook.
tree.predict(X_test)

round(tree.score(X_test, y_test), 4)
The model is not terribly accurate, but given the size of the data it’s not too bad! Simply guessing would yield an accuracy of only 25% and the model achieves 50%.
See the Stocks App for an example of how a model can be incorporated into an app.