Domino Flows comes with a comprehensive user experience to monitor flows. This includes an integrated Domino UI, along with access to the native Flyte UI.
This document goes through some of the available monitoring experiences.
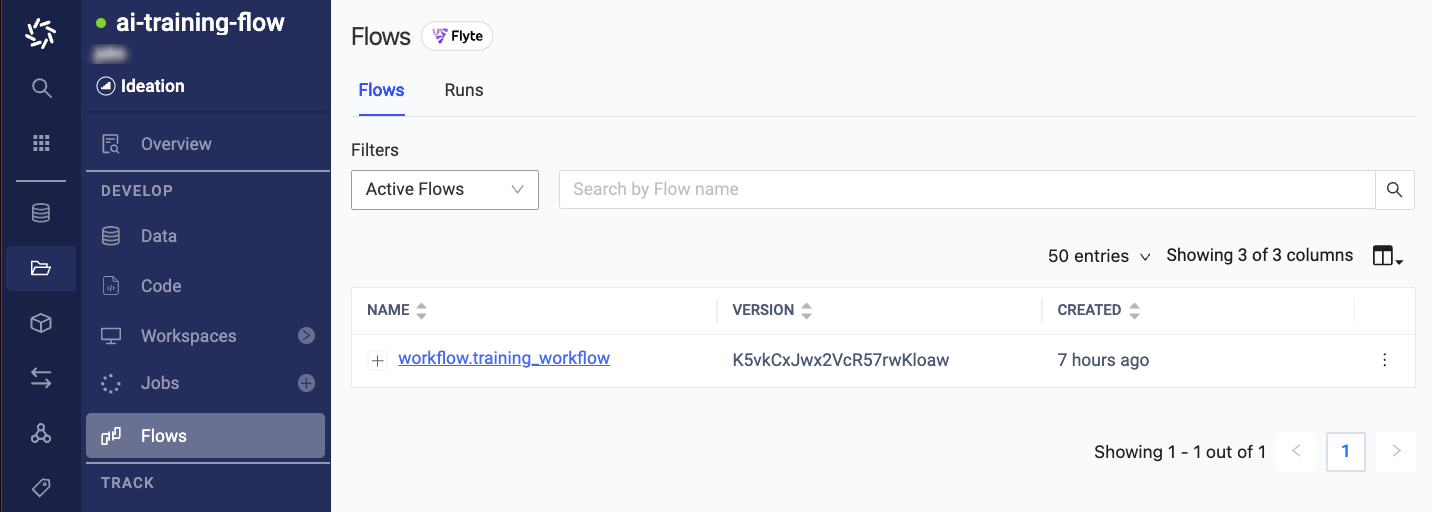
The Domino Flows UI can be accessed by navigating to the Flows page within your Project view. This section documents some of the key experiences that are available on this page.
Flow list
Upon landing in the Flows UI, you will have access to a list of all the flows that have been registered into the Project. In this view, you can:
-
Keep track of and monitor all the flows in your Project.
-
Click on any of the flows to navigate to the Flyte UI.
-
Run or archive a flow by clicking on the overflow button (right side of a row).
-
Filter between active/archived flows or search for flows by name.
-
Change the number of entries and columns to display in the table.
-
Expand the dropdown to view previous versions of the flow.
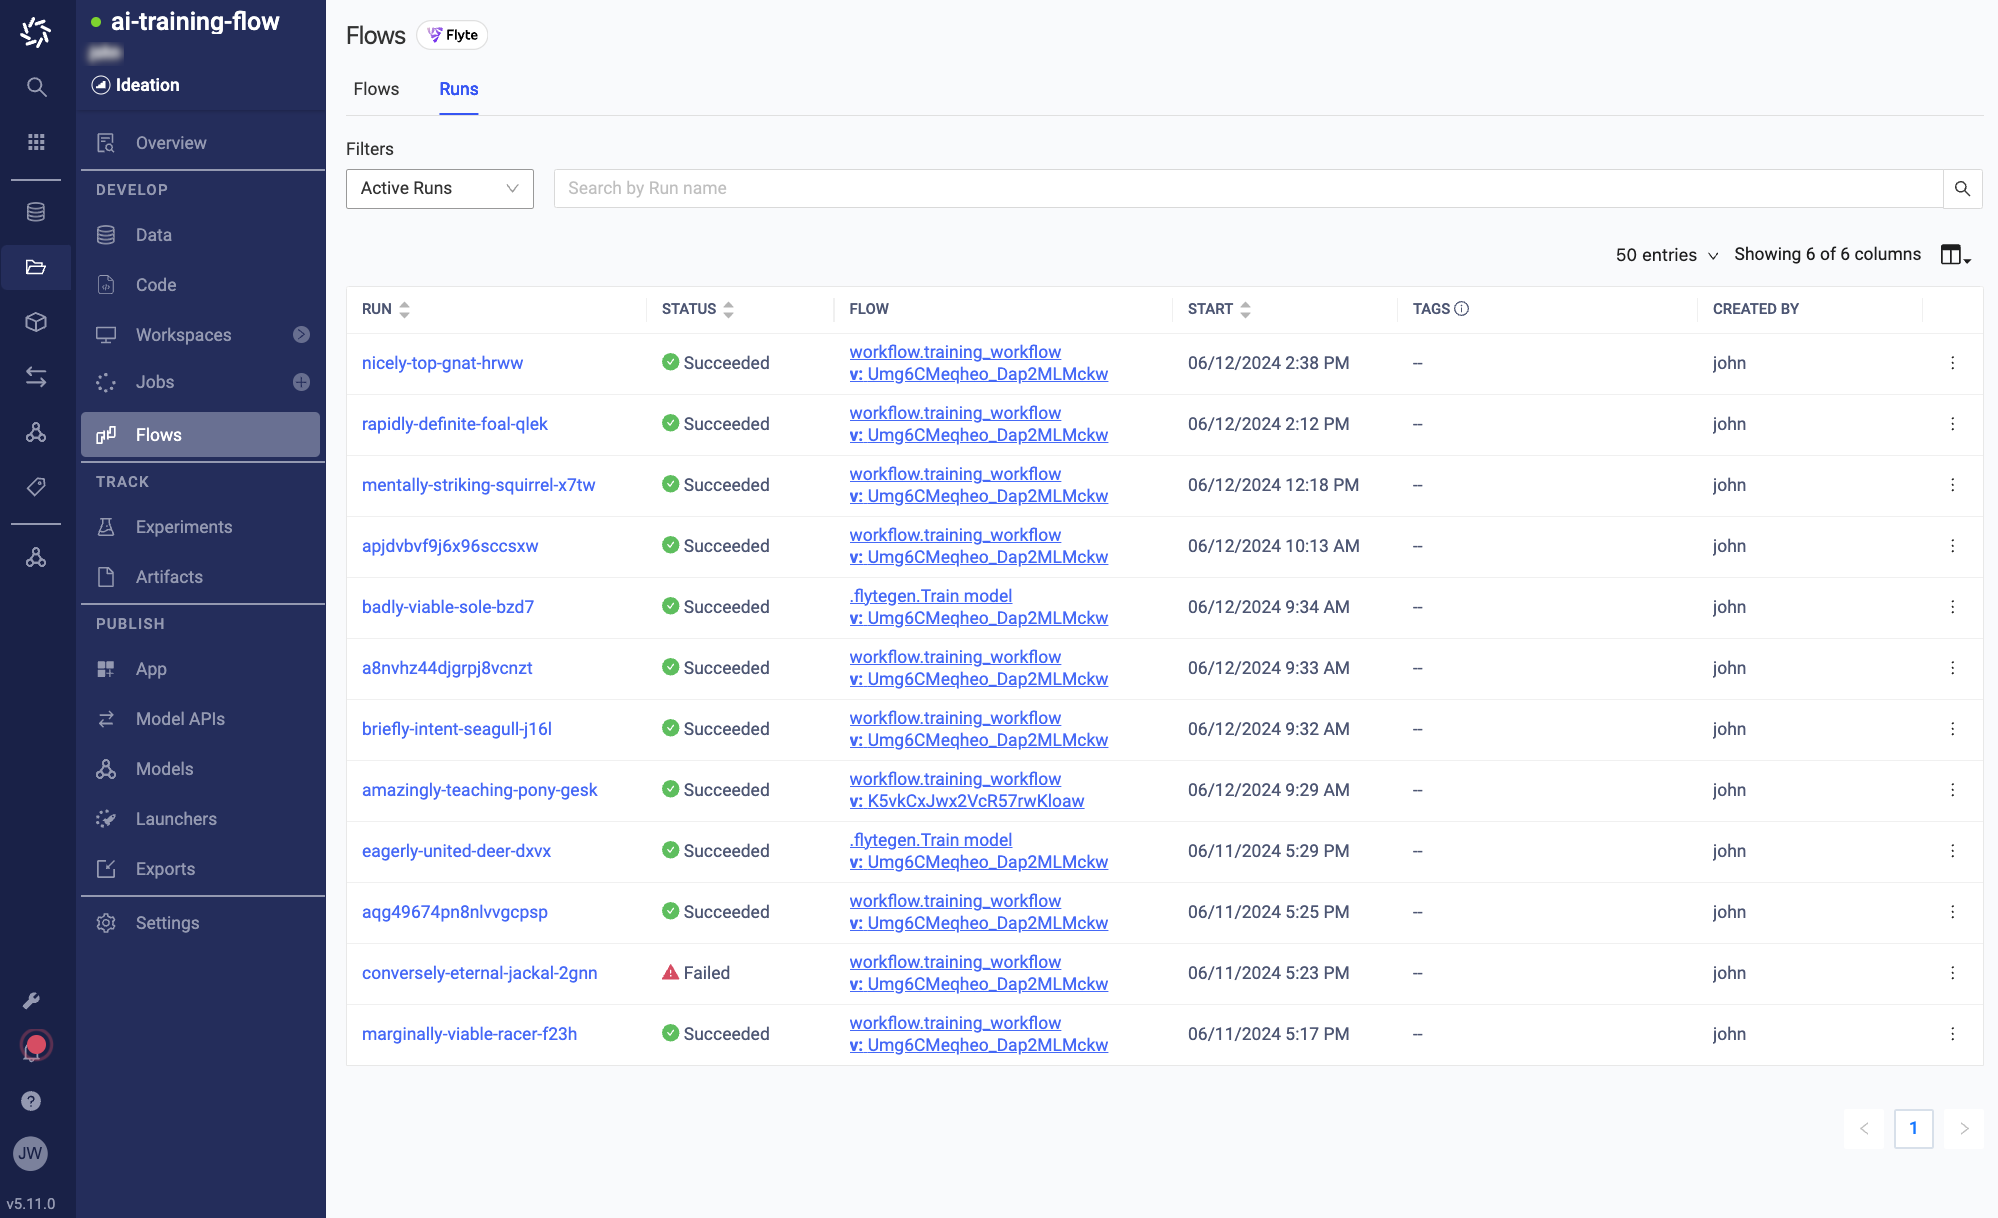
Run list
To see a list of all the flow runs, click the Runs pivot within the Flows page. In this view, you can:
-
Keep track of and monitor the status of all the runs in your Project.
-
Click on any of the runs to navigate to a run details page.
-
Click on any of the flows to navigate to the Flyte UI.
-
Rerun or archive a run by clicking on the overflow button (right side of a row).
-
Filter between active/archived runs or search for runs by name.
-
Change the number of entries and columns to display in the table.
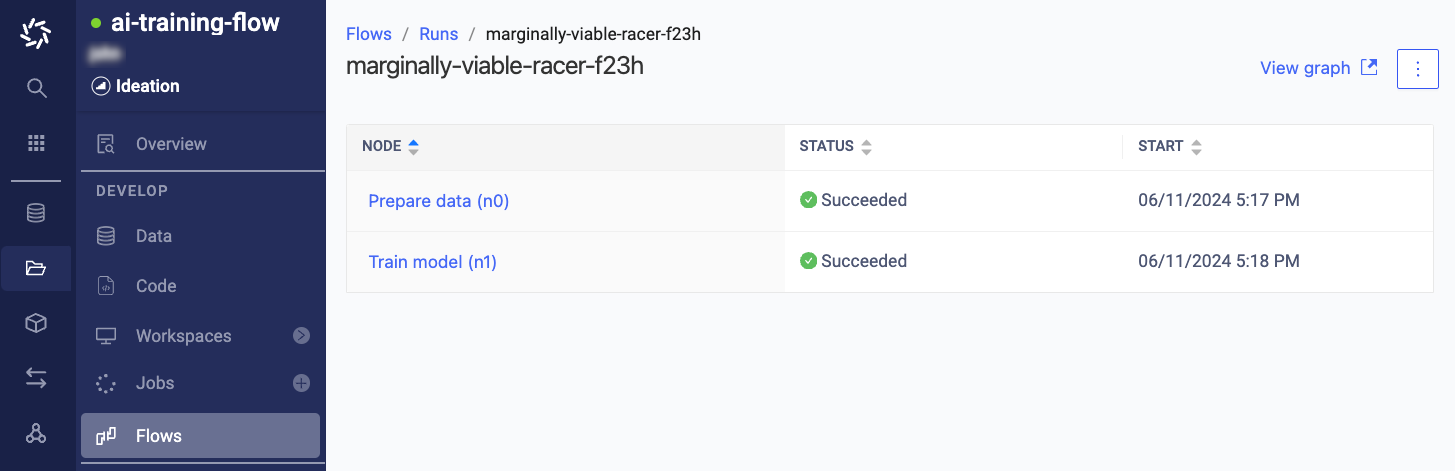
Run details
To see more details about a run, click on the relevant run name to access the Run details page. In this view, you can:
-
View a list of all the nodes along with their execution status.
-
Click into a node to view more details about the results.
-
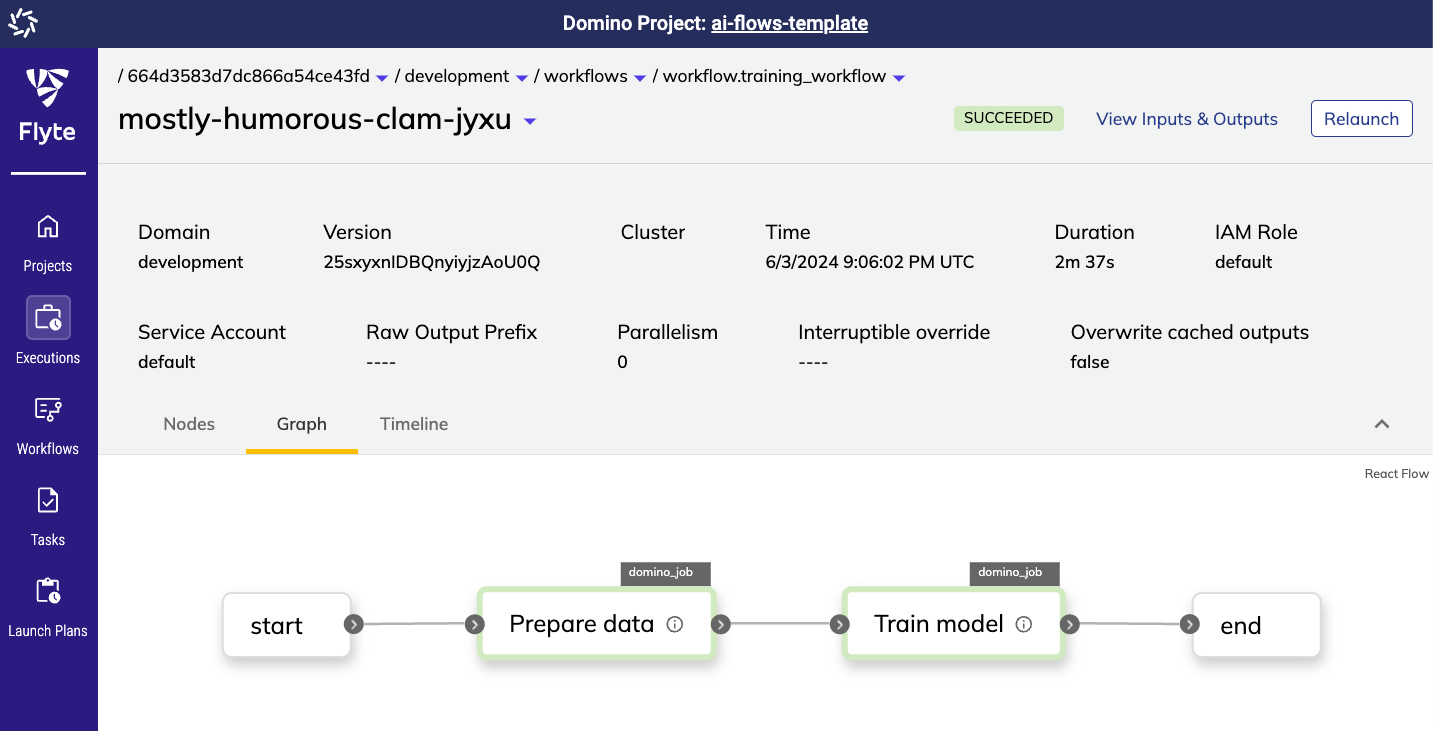
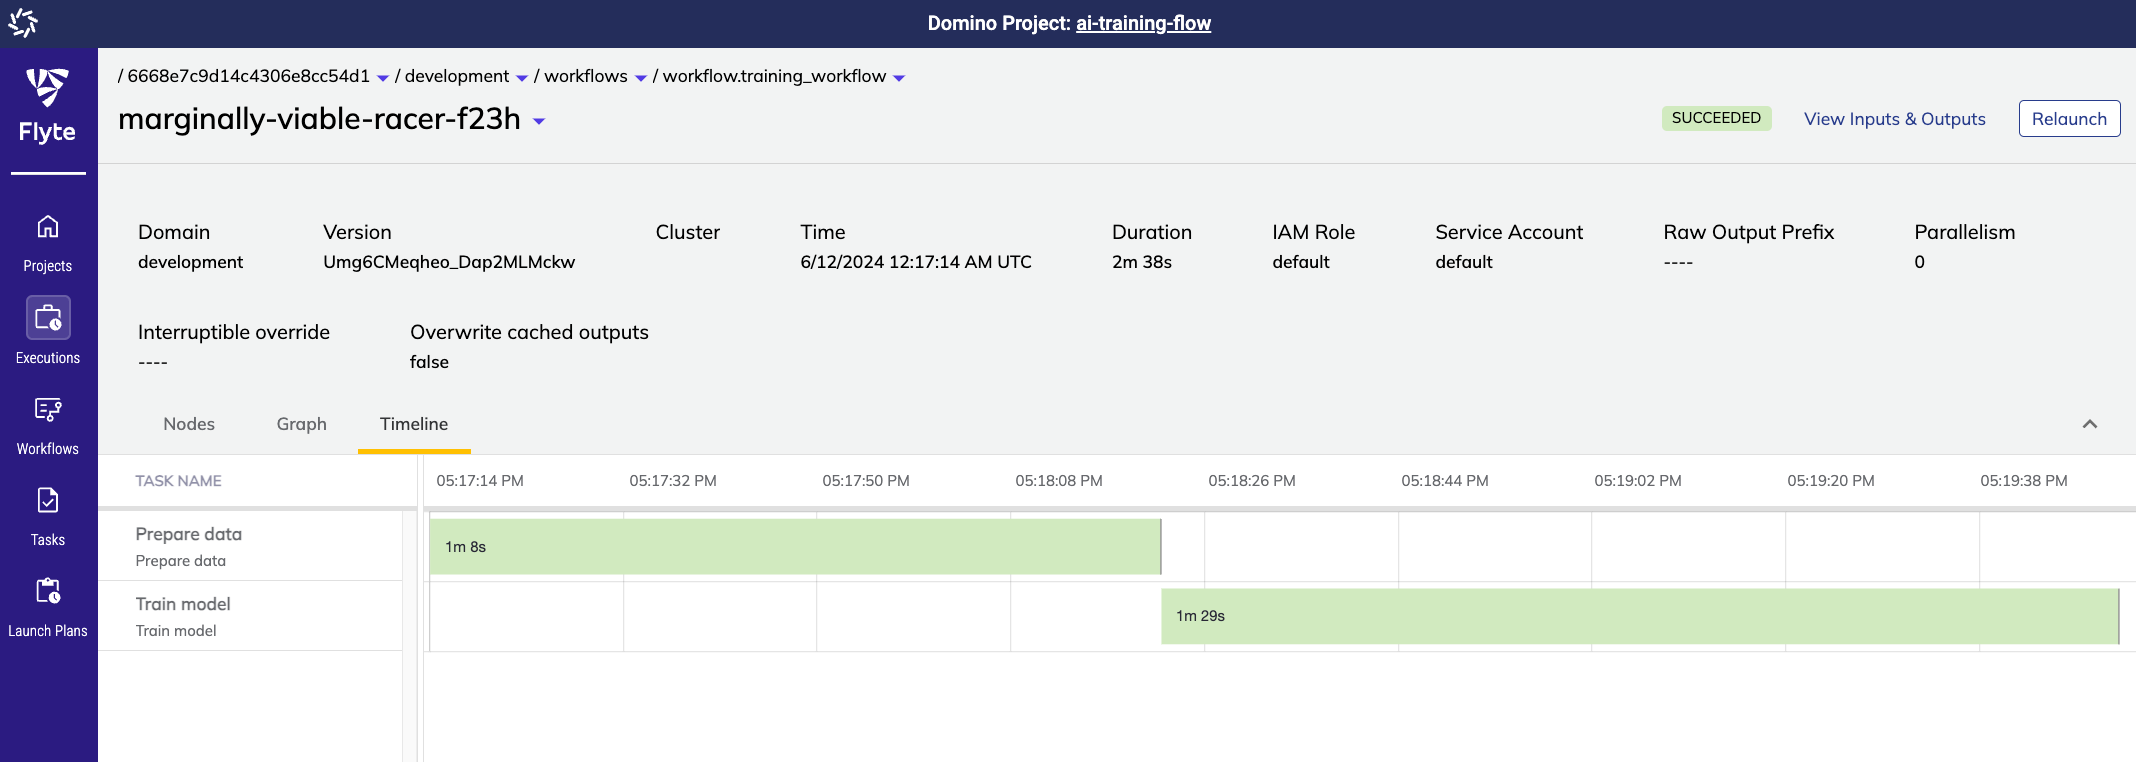
Click out to the Flyte UI (top right) to access a graph view of the flow.
-
Rerun or archive the run by clicking on the overflow button (top right).
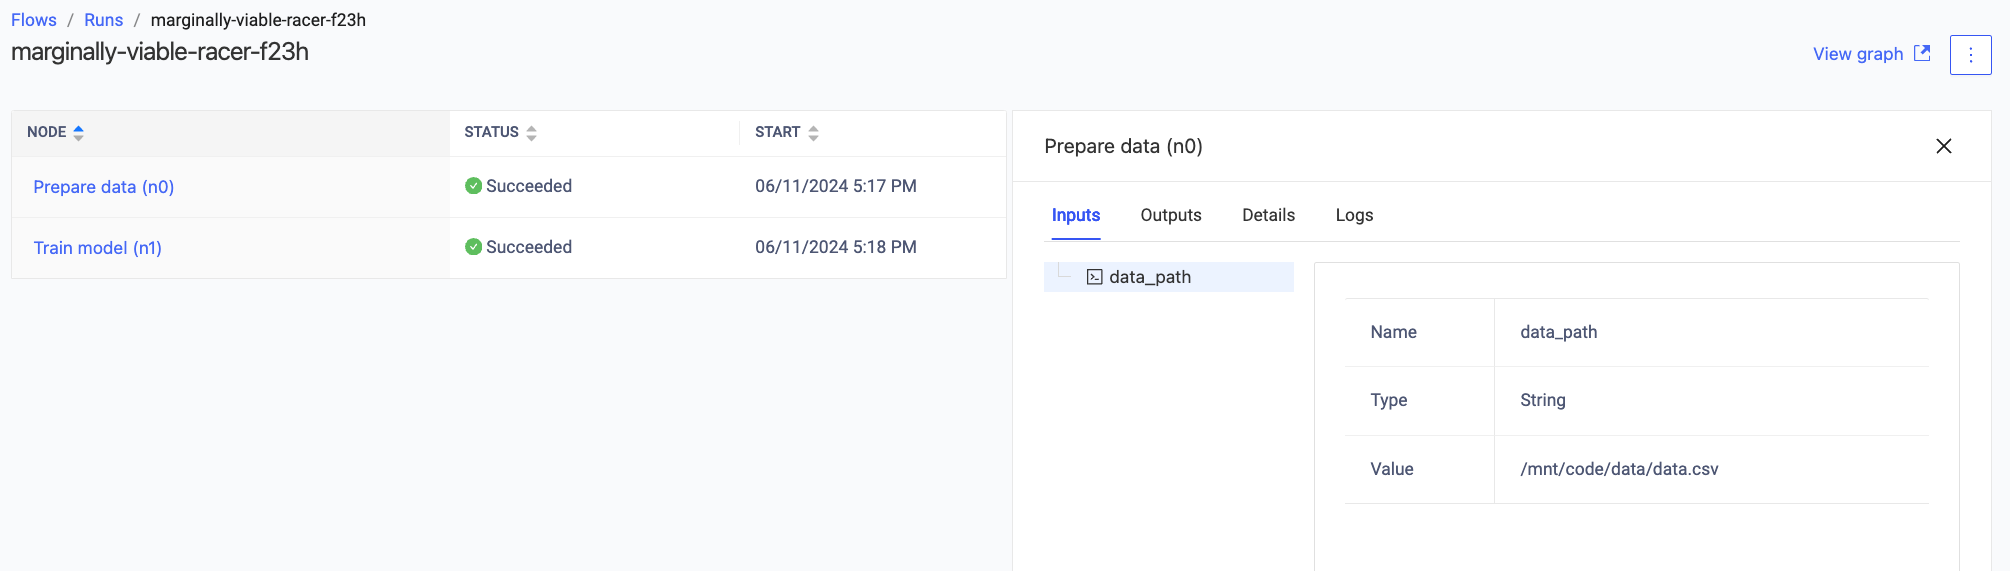
Node details
To see more details about a node, click on the relevant node name to access the Node details panel. In this view, you can:
-
Visualize all the versioned inputs that went into the node.
-
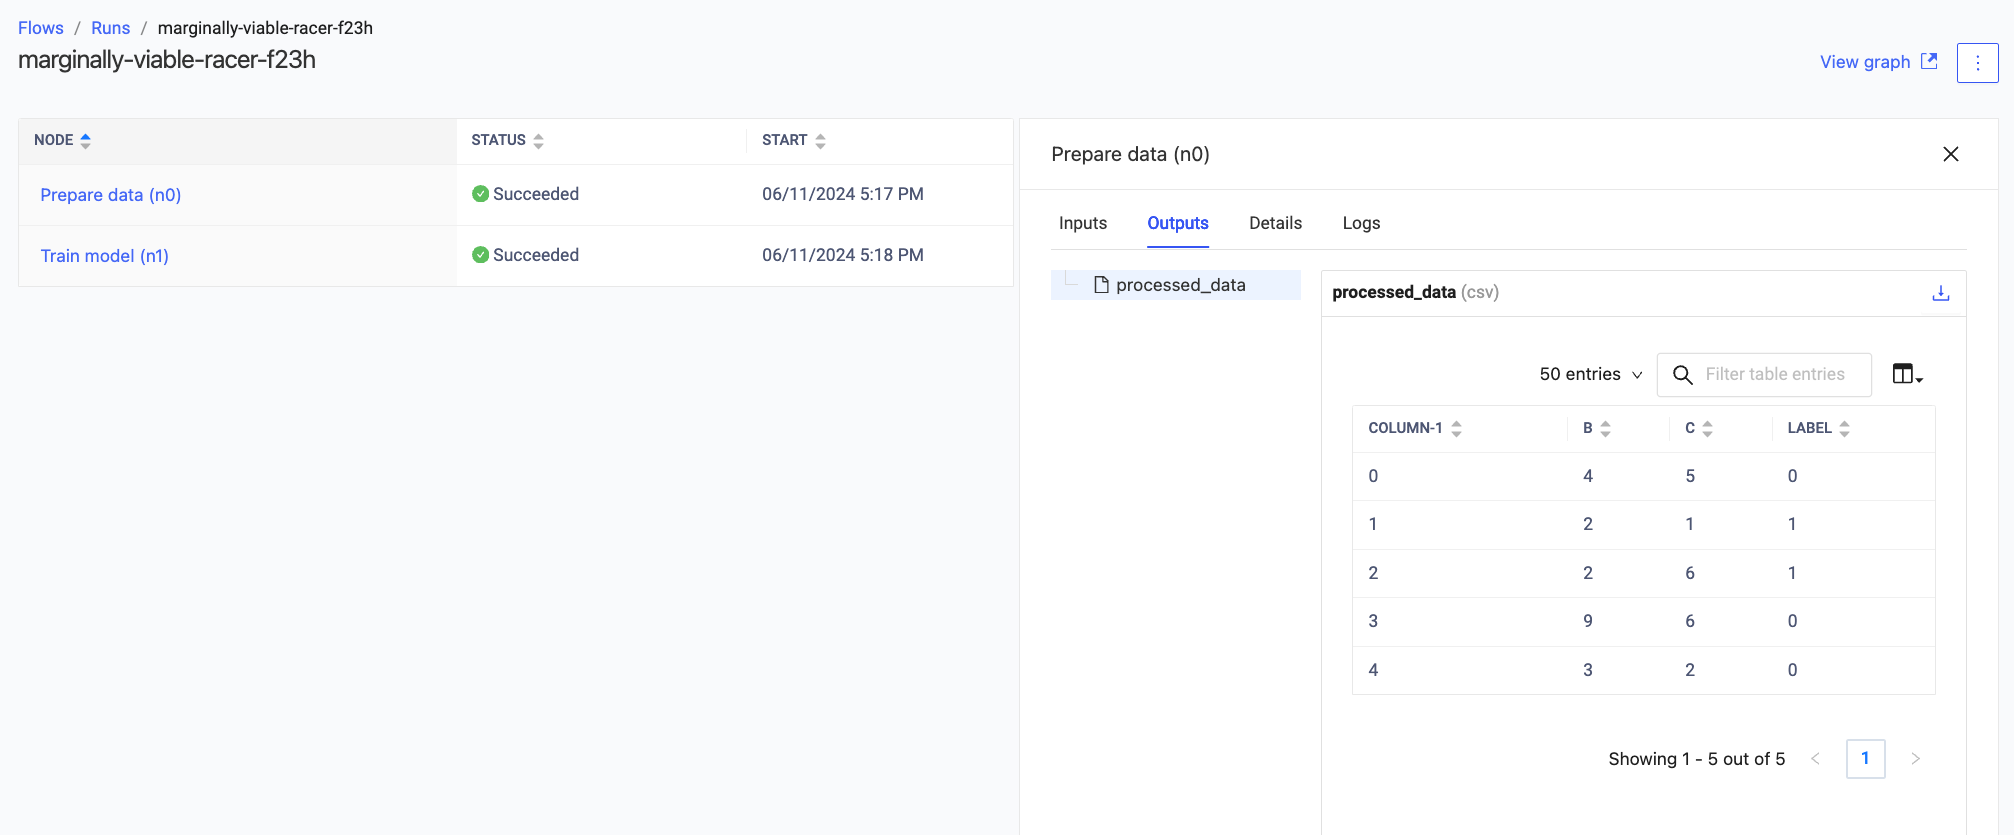
Visualize all the versioned outputs that came out of the node.
-
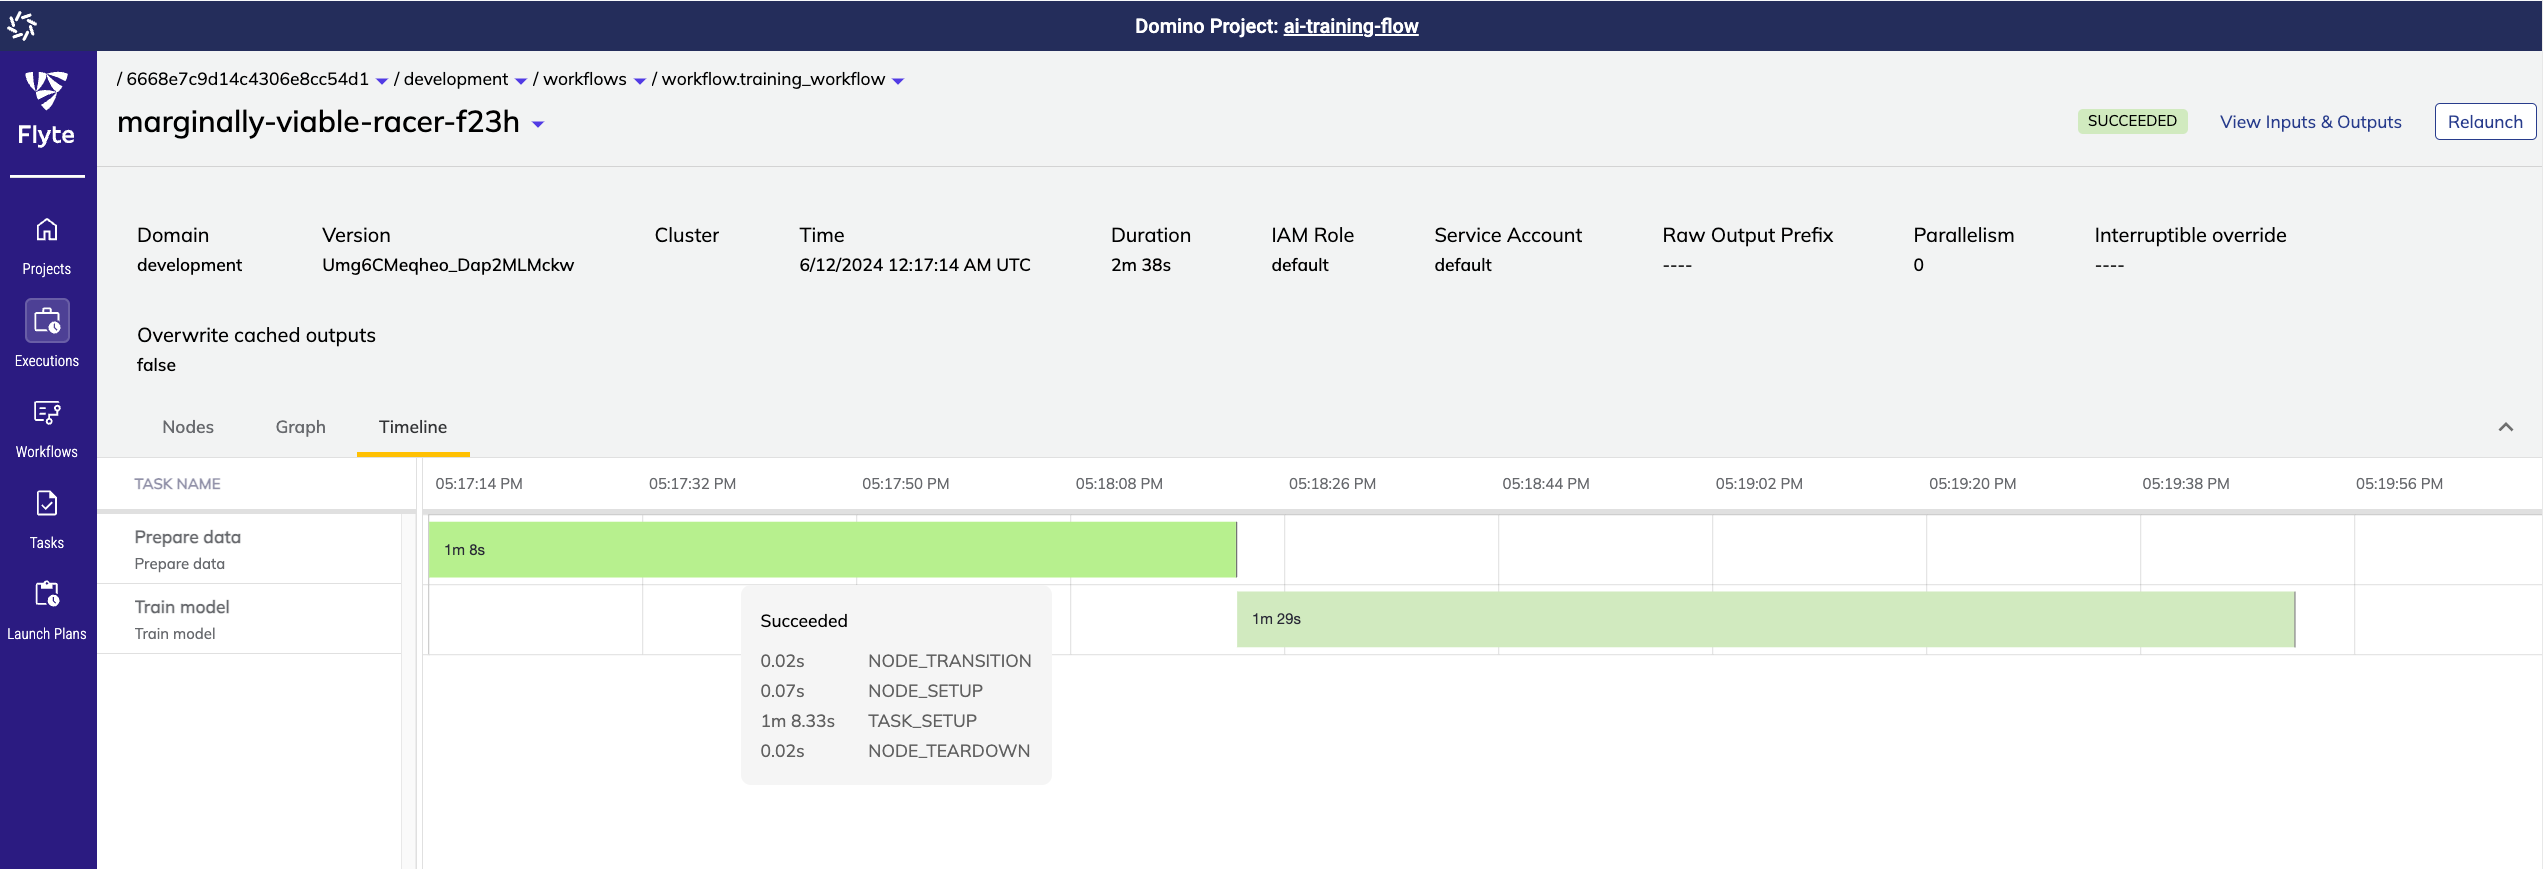
Access execution details about the node, including a link to the corresponding Domino Job.
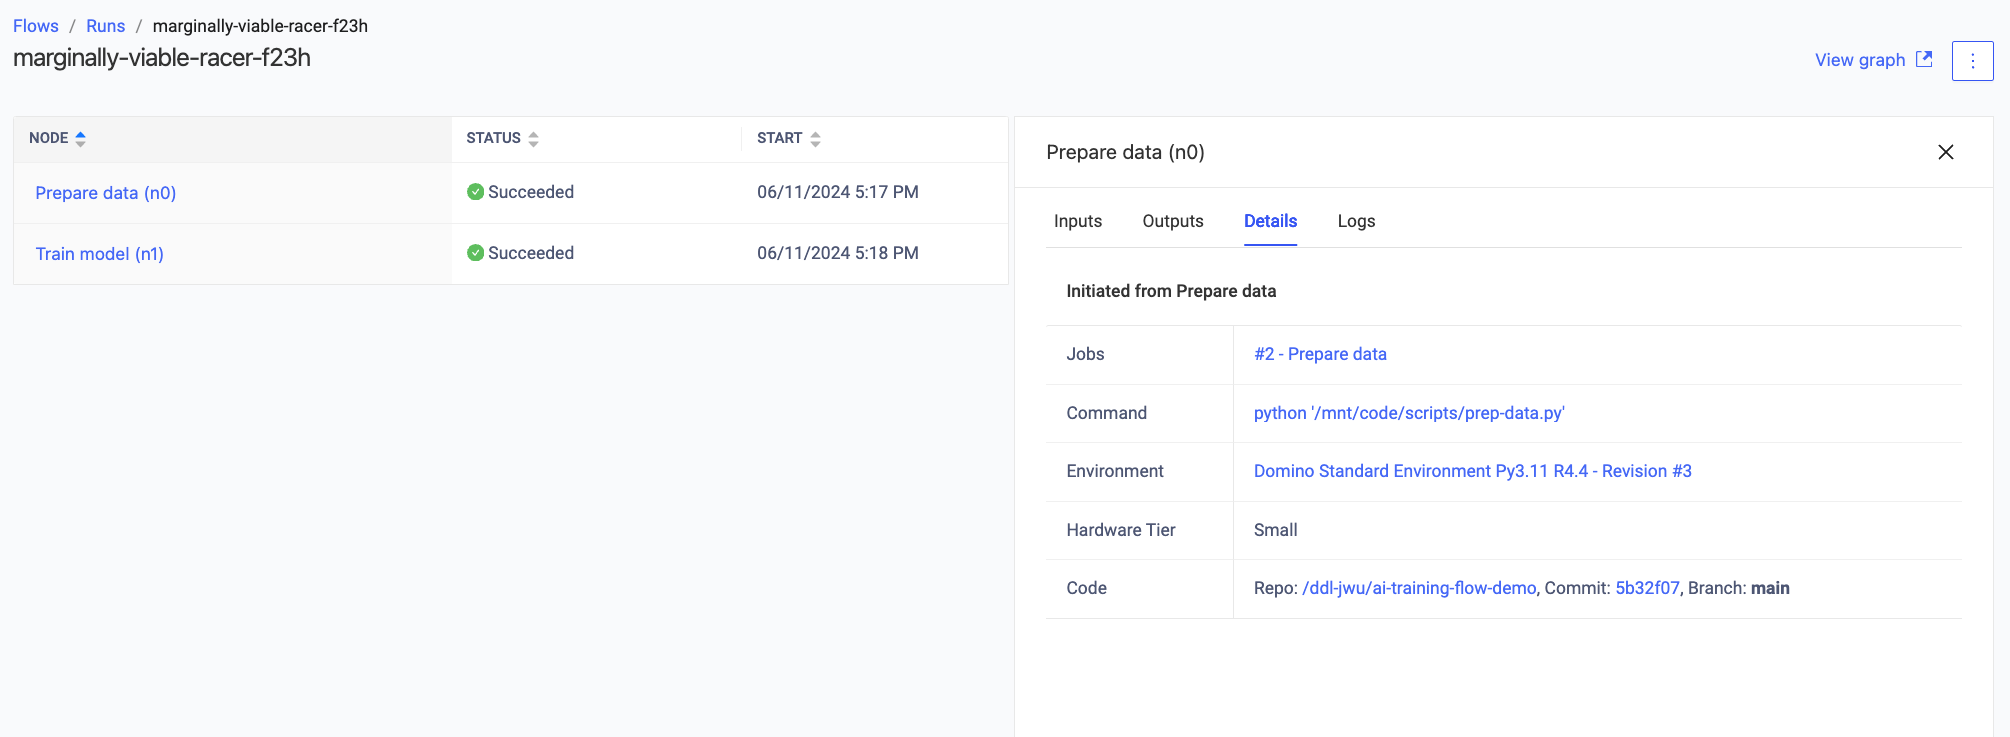
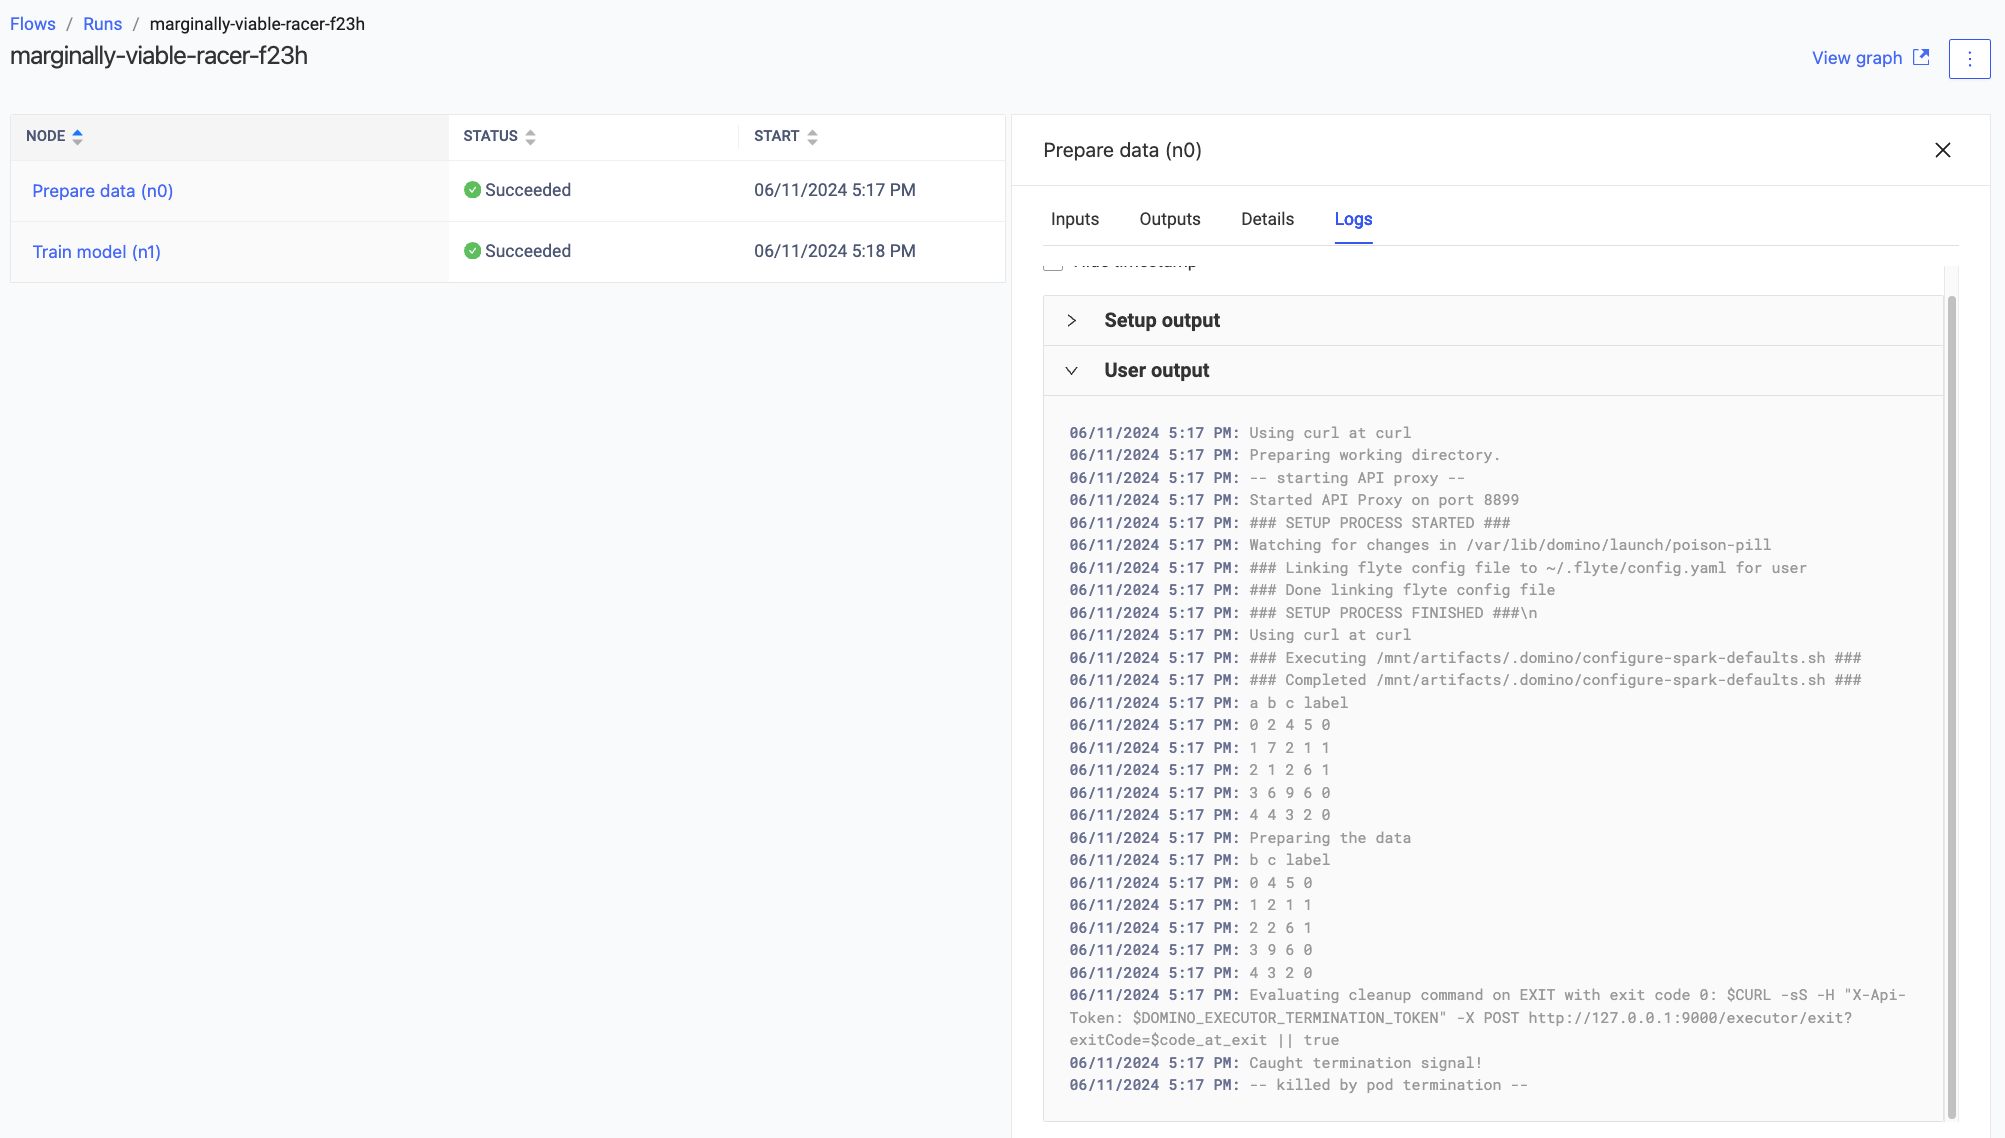
-
Access execution logs.
|
Note
| To enable file rendering, you must explicitly specify the file type when you define the input or output. See defining flows for more details. |
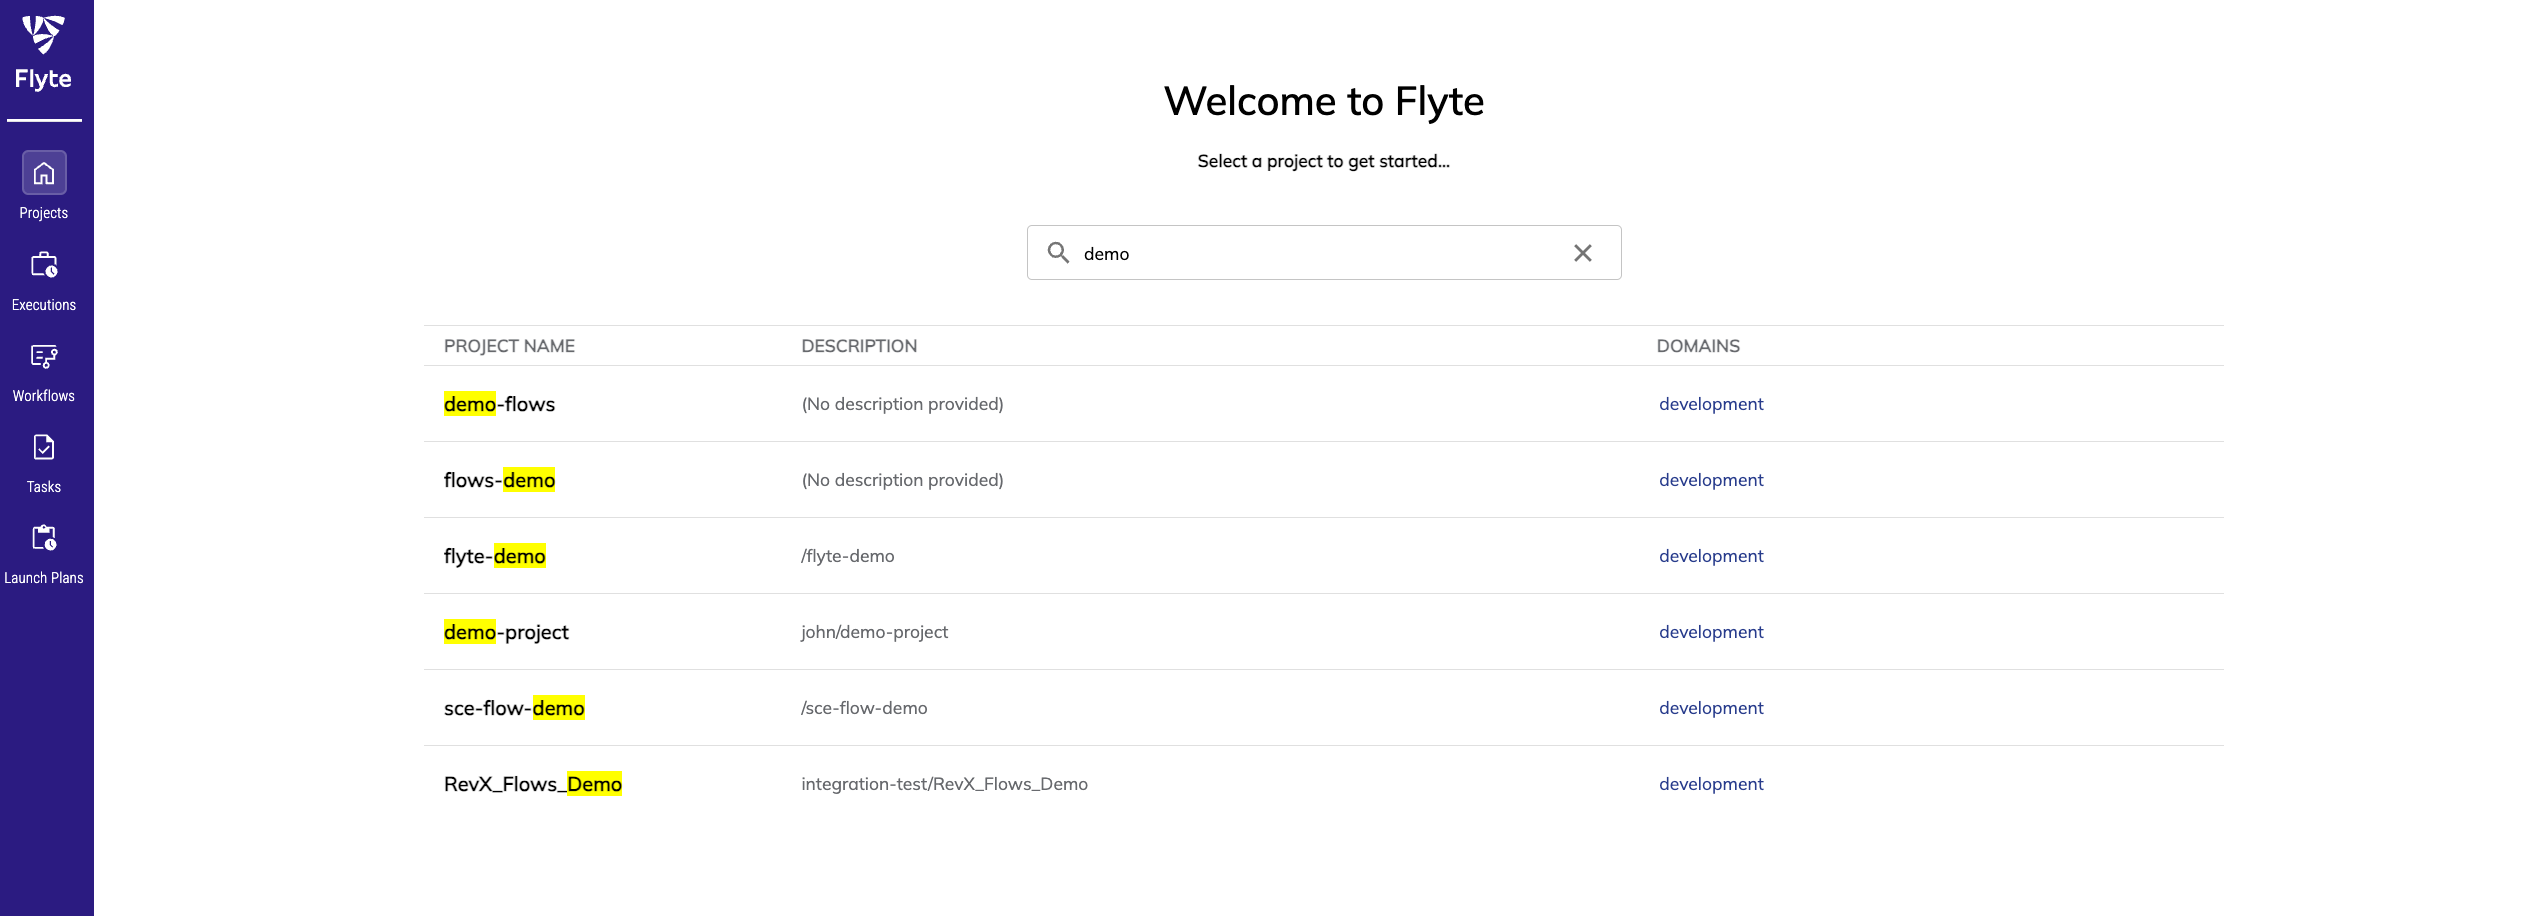
The Flyte UI can be accessed directly at https://{DOMINO-URL}/flows/console/select-project. Within the Flyte UI, you can search for a specific Project or directly click into any of the other pages on the left. There are also several entry points from the Domino UI that will take you directly to specific pages in the Flyte experience.
|
Note
| There is a 1:1 mapping between Projects in Flyte and Domino. |
The Flyte UI offers many of the same capabilities as the Domino UI but also includes some additional, useful features. This section documents some of the key additional views that can help to monitor flows.
|
Note
| Not all native Flyte capabilities are fully supported, so there may be some actions in the Flyte UI that don’t currently work. Additional capabilities will be enabled during future releases. |