The Transformations widget generates summary data for all columns in the dataset. These summaries are generated on the fly and then cached.
For this tutorial we’ll use the Palmer Penguins data.
-
Launch the Transformations widget.
-
Hover over one of the column names at the top of the data preview. A kebab menu appears. Hover over the kebab menu. A summary is generated and displayed.
-
If the column contains categorical or string data (like
island) then the summary will contain a count of (i) the total number of values, (ii) the number of missing values and (iii) the number of missing values. A small bar chart shows the relative frequency of each of the values.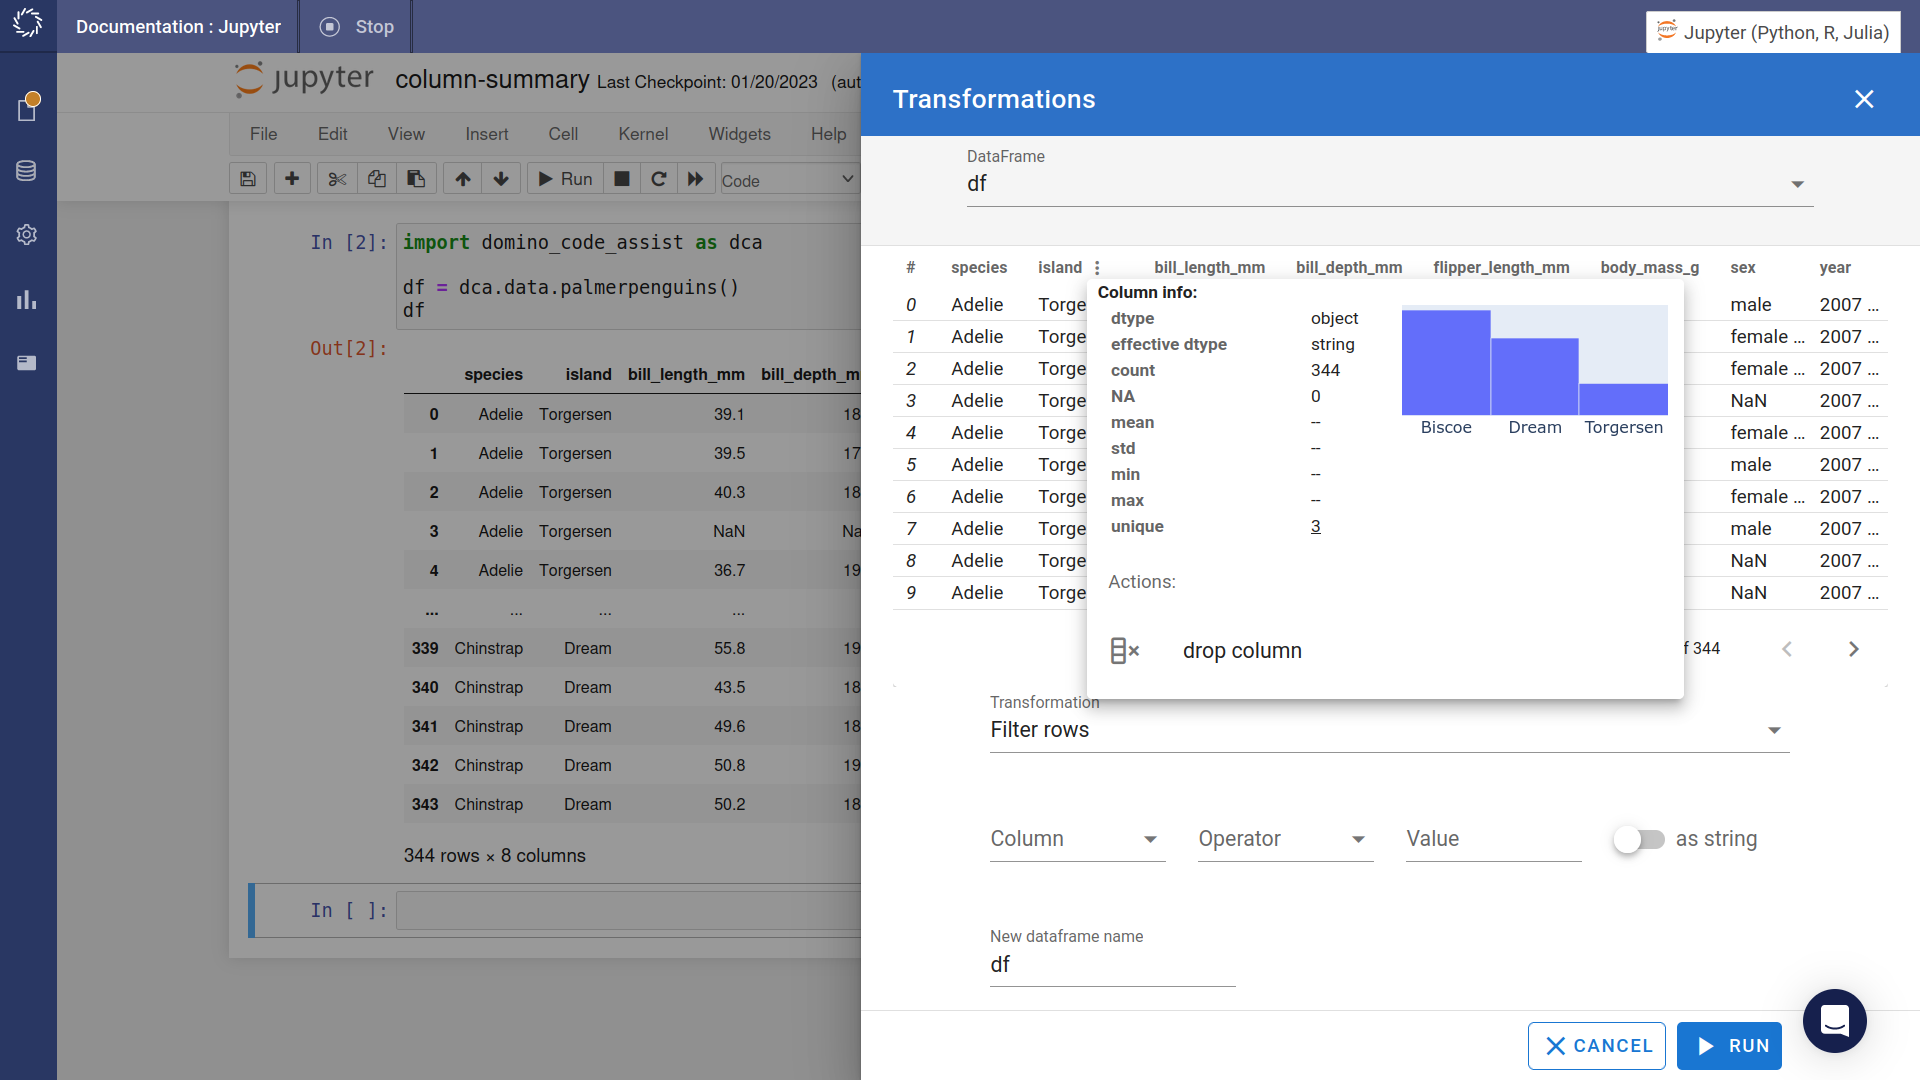
-
For numerical columns (like
bill_length_mm) the summary also contains the mean, standard deviation, minimum and maximum values along with a histogram of the distribution.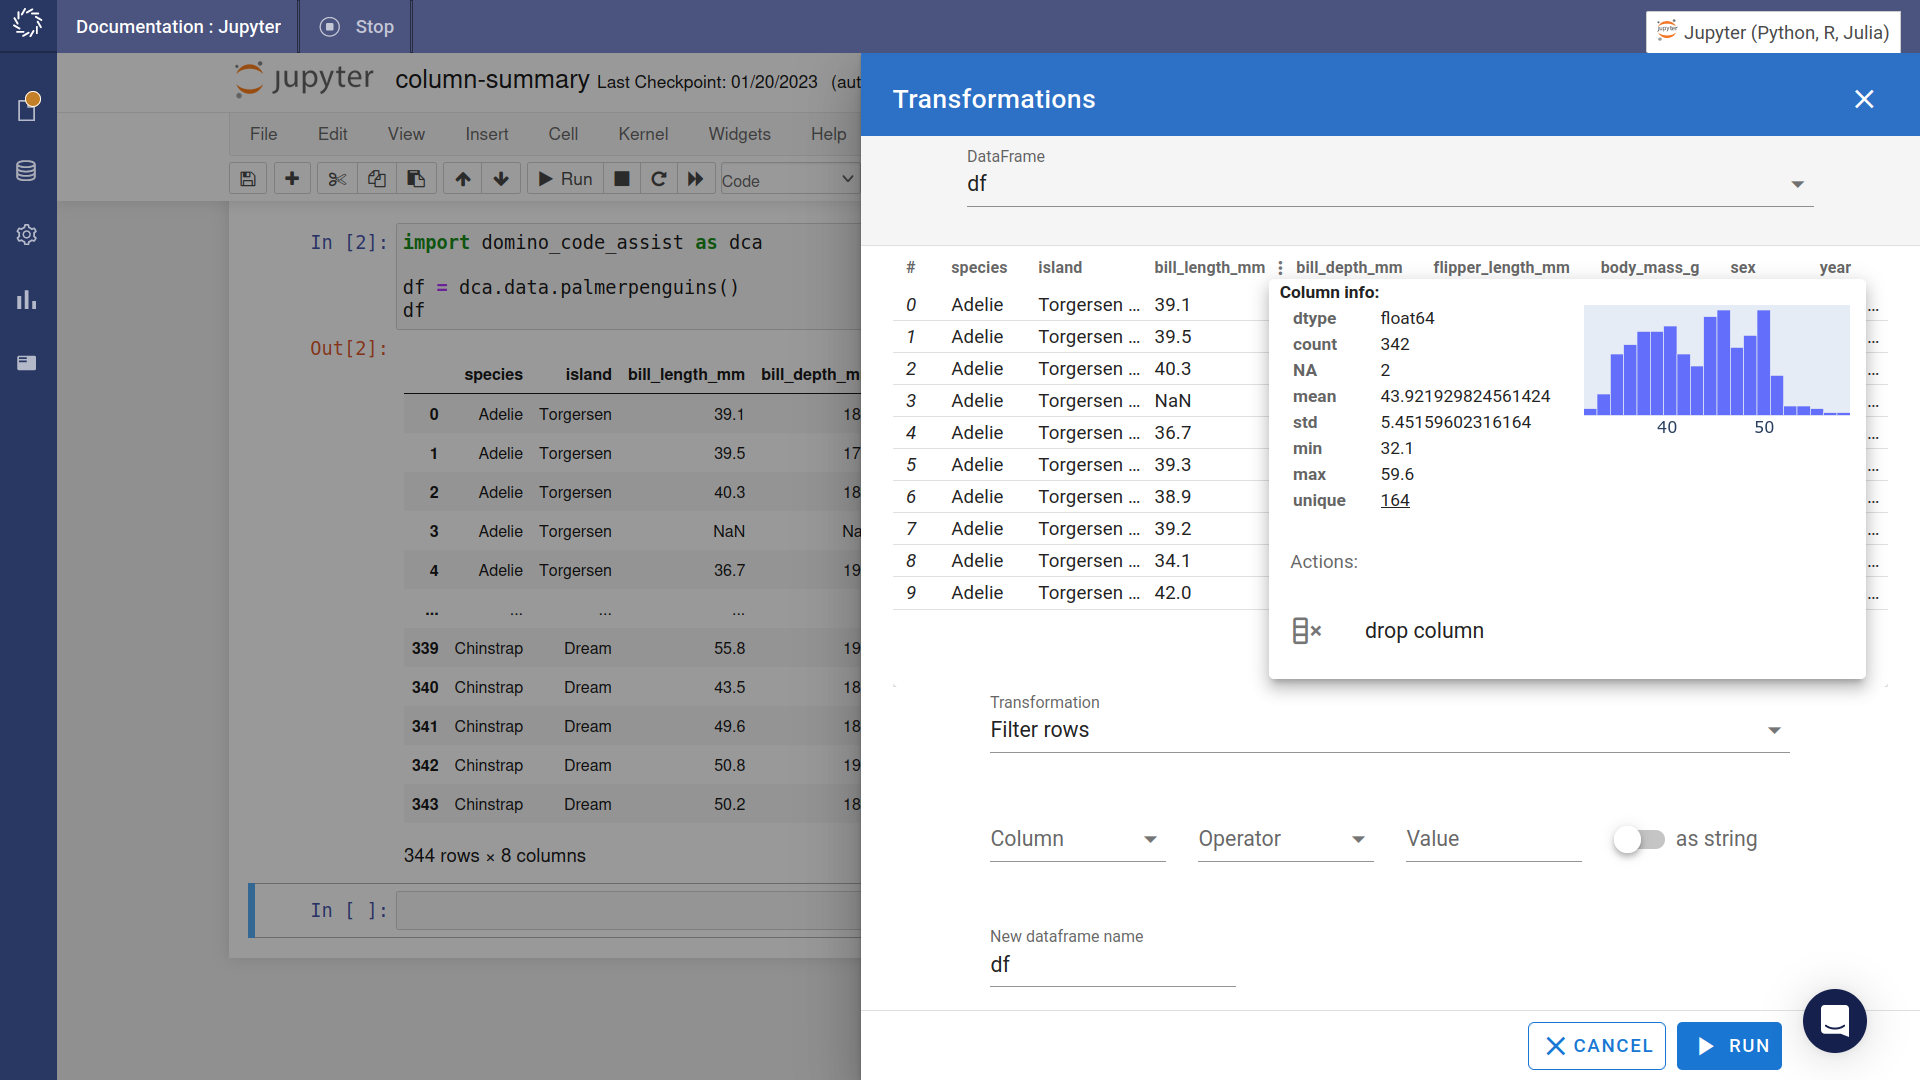
-
At the bottom of the summary there’s a drop column button.
-
Pressing the drop column button removes the corresponding column from the data.
-
Group and aggregate records to generate summary data.