Use Code Assist, and just a few clicks, to bring your analysis to life with data visualizations.

-
Initialize Code Assist by clicking button.
-
To get started, hover over the
 icon and select the Visualization item from the menu.
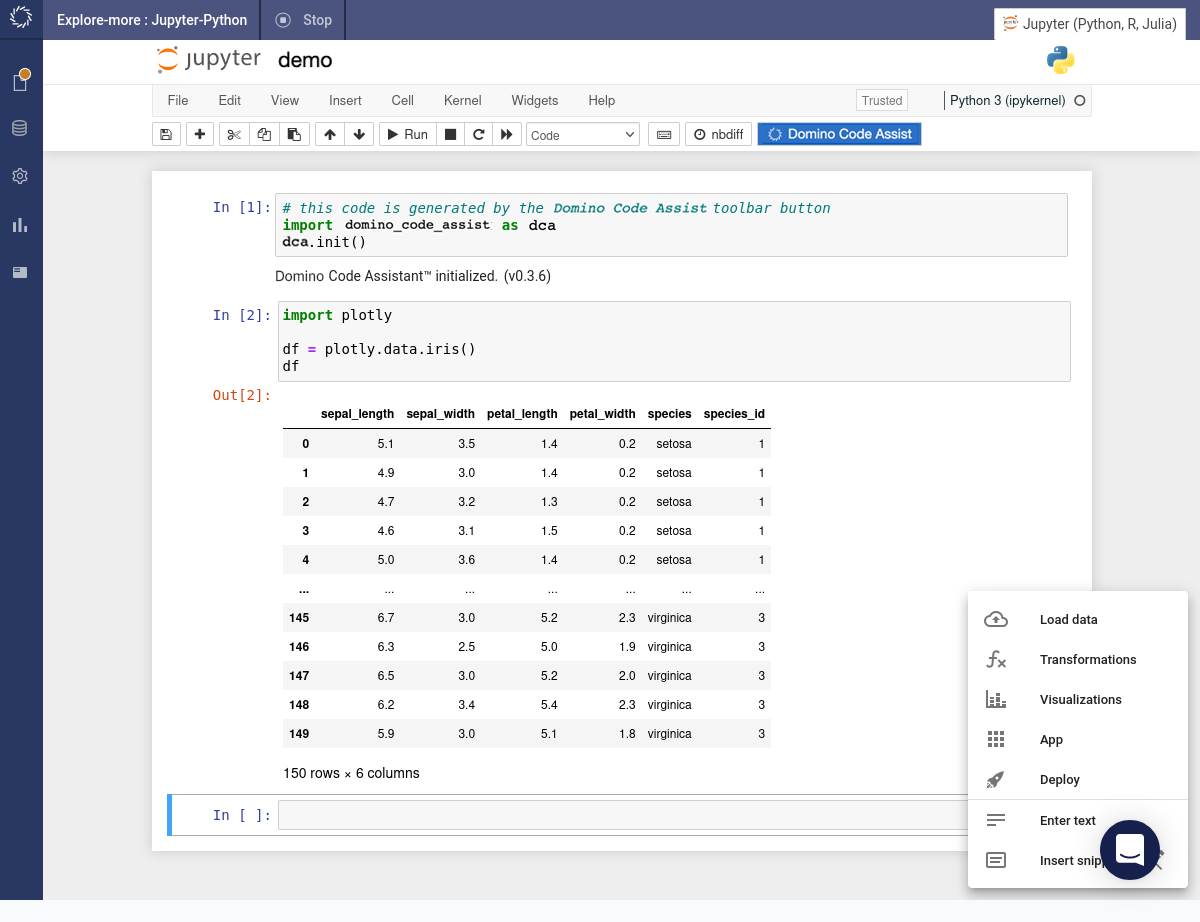
-
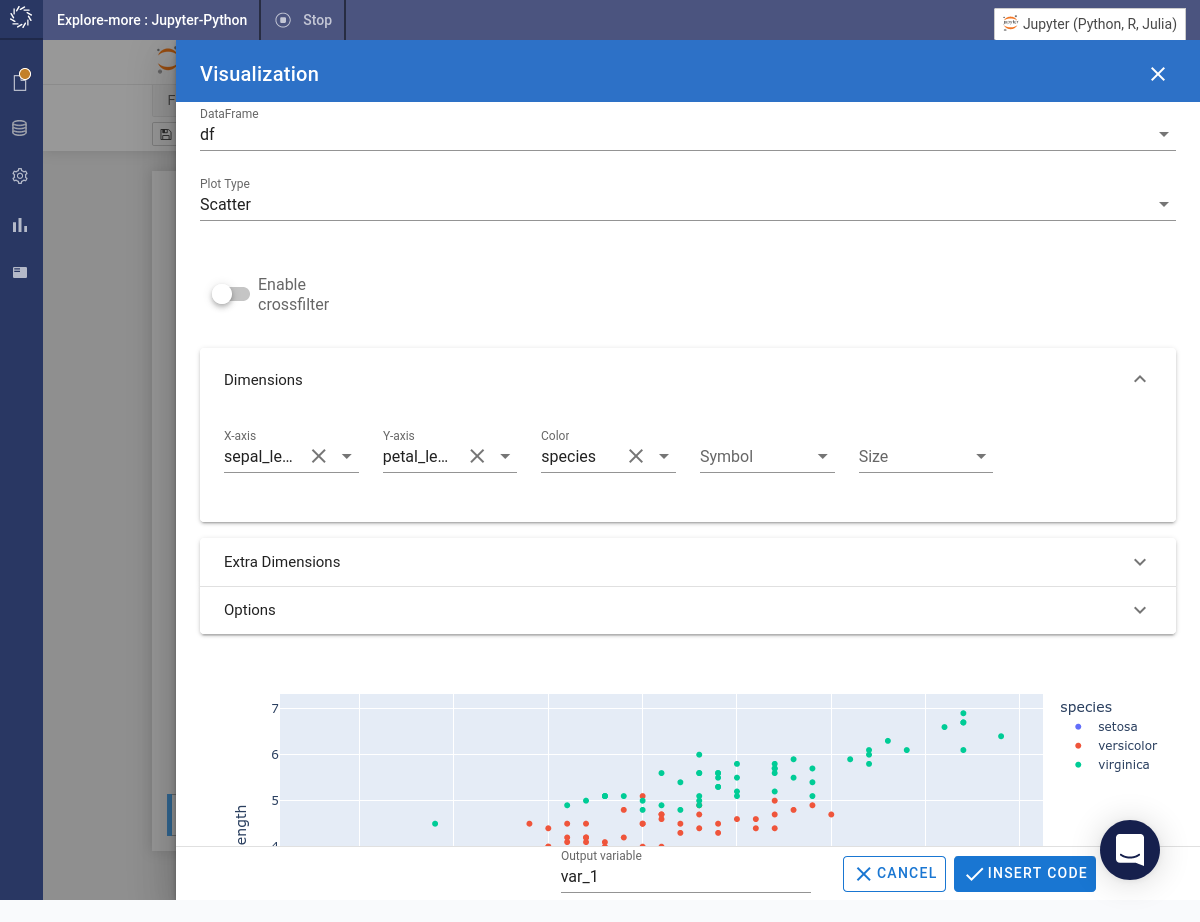
Configure the visual by selecting:
-
Data frame
-
Plot type
-
Parameters
-
-
Then click .
-
Code Assist will add the code to create the visualization into the next cell.