Domino’s Cost Center dashboard gives administrators clear visibility into cloud costs for your Domino deployment. They can quickly see how resource usage and cost trends over time map to your organization from within Domino.
Administrators can view total expenses and break them down by resource type, such as CPU, GPU, storage, and cloud services. They can also analyze spending by time period and top contributors, including users, projects, organizations, billing tags, workloads, and workload types. This feature helps with both overall cost tracking and detailed analysis of usage patterns. Domino Cost Center helps reduce project costs by:
-
Automatic allocation of usage-based costs to organizational entities (users, projects, etc) and workload.
-
Optimization of dataset storage usage to reduce cloud storage costs.
-
Proactive spend control by setting budgets and sending alerts to stakeholders, administrators, and team members approaching their limits.
-
Generation of chargeback/showback reports using APIs to facilitate cost recovery across organizations and engage with high-expenditure users to optimize infrastructure usage.
Domino Cost Center automatically tags all infrastructure usage with essential metadata, associating costs with specific Domino projects, organizations, users, and billing tags, allowing for detailed, usage-based cost allocations.
The Cost Center dashboard provides a pre-configured canvas to get you started. Access it from the main Domino page as an Administrator:
-
From Domino, go to the top navigation bar.
-
Open Govern > Cost center.
-
The Cost Center dashboard loads with the default view.
-
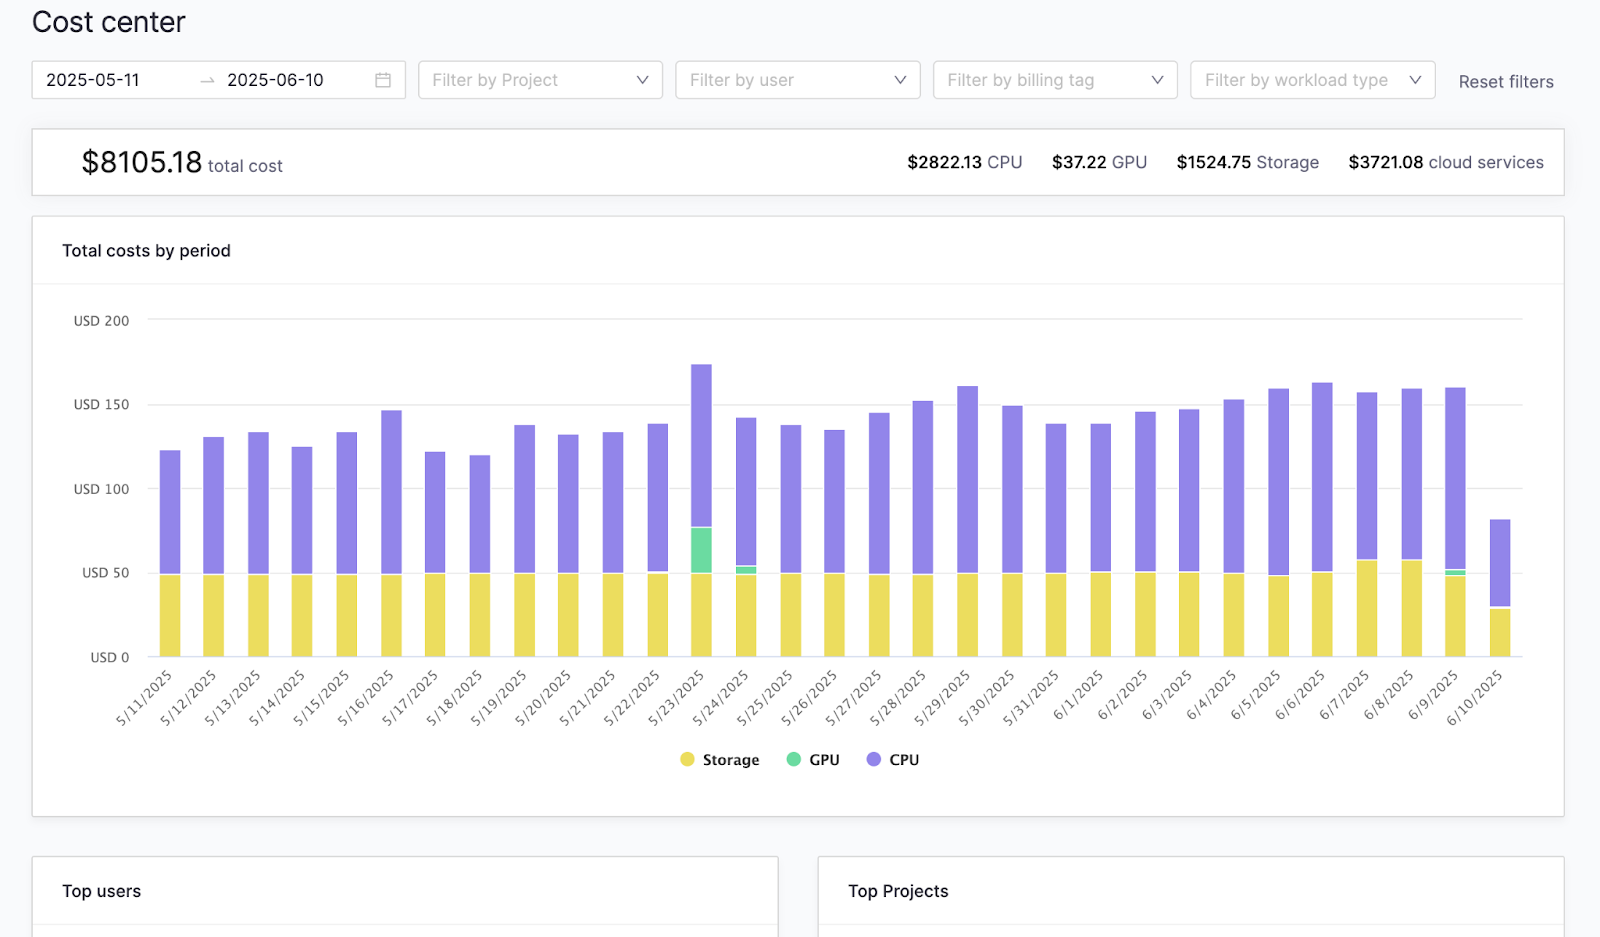
Date picker: Click the date picker in the top left to select a date range, either 7 days, 30 days, 6 months, or a custom range (limited to 1 year).
-
Filter by… Use the filter controls at the top of the dashboard to narrow your data by category: Project, user, billing tag, or workload type.
-
total cost bar: Shows numerical cost data over the selected date range. Cost is broken down by: CPU, GPU, Storage, Cloud services. Note that the cloud costs represent shared infrastructure expenses. This cannot be attributed to specific users, projects, or workloads. Even though they are included in the overall total, cloud costs will not appear in charts and summaries after filters are applied.
-
Total costs by period: Displays a time-based breakdown of expenditures. Hover over a bar to view detailed costs by resource type.
-
Top contributors: Scroll down to explore top contributors, organized by category: Top users, Top projects, Top organizations, Top billing tags, Top workloads, or Top workload types. Hovering over a bar reveals the exact spend associated with that contributor.
-
Prevent overspending by setting budgets and sending alerts to stakeholders, administrators, and team members approaching their limits.
-
Learn more about automatic allocation of usage-based costs.
-
Reduce cloud storage costs by optimizing dataset storage usage.
-
Learn about how costs are calculated.