Data Visualizer is an AI-powered dataset analysis application that helps you explore, filter, and visualize data through an intuitive web interface. It supports natural language queries and provides interactive visualizations for clinical and general datasets.
Data access
Data Visualizer reads data files from the datasets folder in your Domino project.
Supported formats include:
-
CSV (.csv)
-
Parquet (.parquet)
-
SAS (.sas7bdat)
-
SAS Transport (.xpt)
Add your data files to the project’s datasets folder, and they will appear in the dataset dropdown when the app loads.
|
Note
| The app runs with the permissions of the user who deployed it (the app owner), not the visiting user. All visitors will have the same read access to datasets as the owner. This behavior will be improved in a future release. |
Column Labels (Friendly Names)
Data Visualizer supports human-readable labels for column names, useful for datasets with cryptic variable names (e.g., CDISC/ADaM clinical data). When enabled, column headers and dropdowns display friendly labels instead of raw column names.
Enable Friendly Names in the UI:
Toggle the Friendly Names checkbox in the header bar to switch between raw column names and human-readable labels.
Configure the Labels File:
Create a file named column_labels_simple.csv in your project root with two columns:
column_name,label
AGE,Age
ARM,Description of Planned Arm
BMIBL,Baseline BMI (kg/m^2)
USUBJID,Unique Subject Identifier
The app automatically loads this file on startup. If the file doesn’t exist, the Friendly Names toggle will have no effect.
Example Labels File:
The project includes a sample column_labels_simple.csv file with CDISC ADaM variable mappings:
| column_name | label |
|---|---|
| Age |
| Pooled Age Group 1 |
| Description of Planned Arm |
| Baseline BMI (kg/m^2) |
| Unique Subject Identifier |
| Planned Treatment for Period 01 |
You can modify this file to add labels for your own datasets. The mappings apply across all loaded datasets - any column matching a column_name entry will display the corresponding label.
Environment variables
Configure the following environment variables in your Domino project settings:
Required for Governance Features:
| Variable | Description |
|---|---|
| Your Domino deployment URL (e.g., |
Optional - AI Chat Feature:
To enable the natural language chat feature, configure an LLM provider:
| Variable | Description |
|---|---|
| API key for your LLM provider (not required for local Ollama) |
| Base URL for OpenAI-compatible API (default: |
| Model name to use (default: |
Example configurations:
-
OpenAI: Set
LLM_API_KEY=sk-xxxand optionallyLLM_MODEL=gpt-4o -
Local Ollama: Set
LLM_BASE_URL=http://localhost:11434/v1andLLM_MODEL=llama3 -
Azure OpenAI: Set
LLM_BASE_URL=https://your-resource.openai.azure.com/openai/deployments/your-deploymentandLLM_API_KEY -
Together AI: Set
LLM_BASE_URL=https://api.together.xyz/v1,LLM_API_KEY, andLLM_MODEL=meta-llama/Llama-3-70b-chat-hf
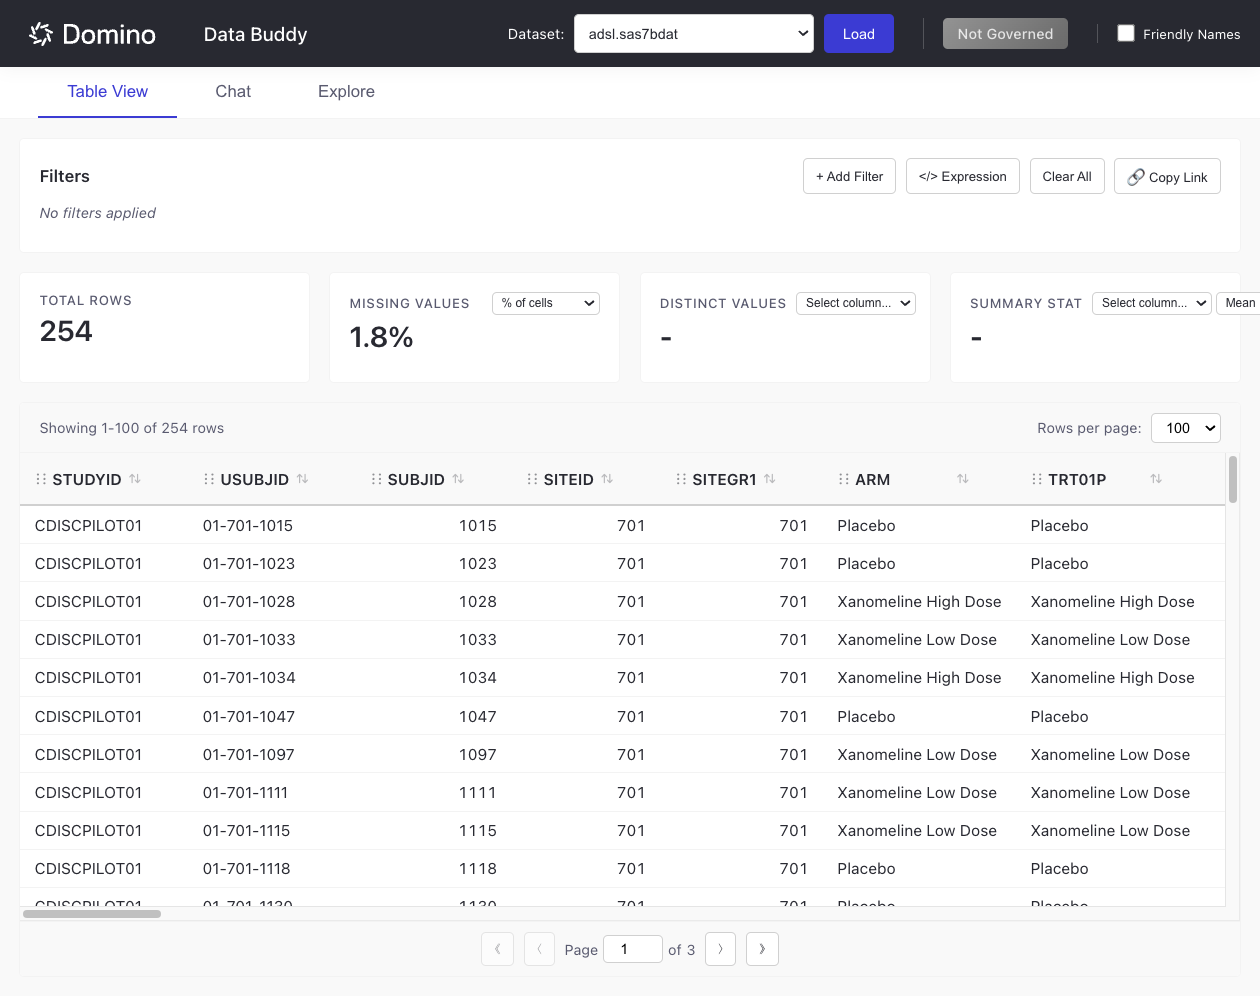
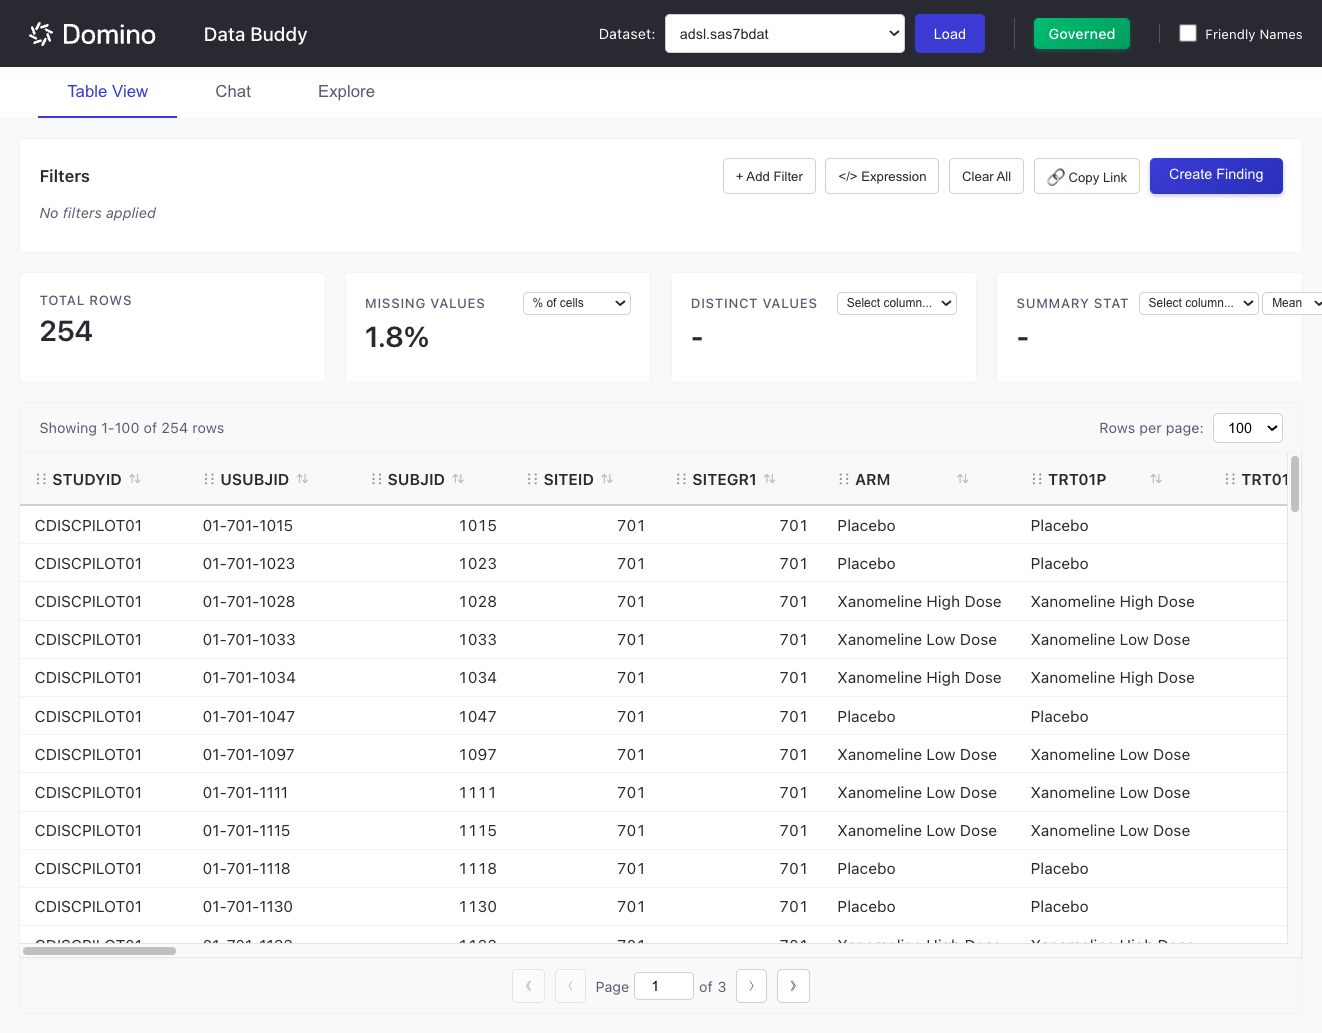
The Table View provides an interactive data table for browsing and filtering your datasets.
Load a Dataset
-
Select a dataset from the Dataset dropdown in the header.
-
Click Load to load the data.
The interface displays:
-
Total Rows: Number of rows in the dataset (updates when filtered)
-
Missing Values: Percentage or count of missing data
-
Distinct Values: Unique value count for selected columns
-
Summary Stat: Aggregated statistics for numeric columns
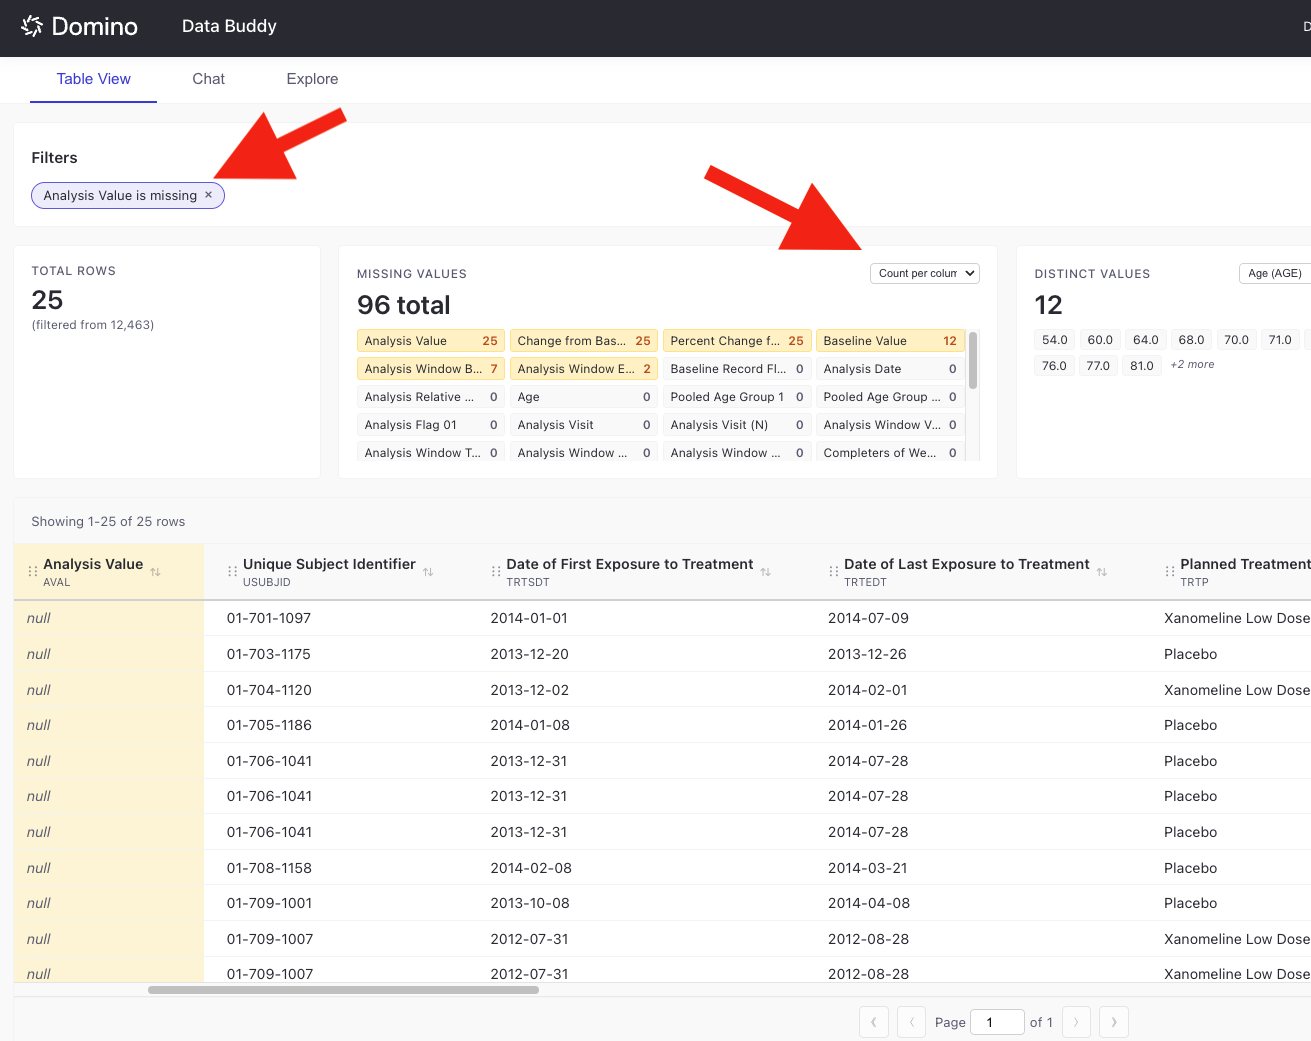
Analyze Missing Values
The Missing Values panel provides a detailed breakdown of null or missing data across all columns:
-
View the total count of missing values across all columns.
-
See per-column badges showing which fields have missing data and how many.
-
Click any column badge to instantly filter the table to show only rows where that column is missing.
-
Applied missing value filters appear as filter badges (e.g.,
Analysis Value is missing).
This feature helps you quickly identify data quality issues and investigate specific missing values in your dataset.
Add Filters
Use the Filter system to narrow down your data:
-
Click + Add Filter.
-
Select a column from the dropdown.
-
Choose an operator (e.g.,
is,is not,contains,greater than,between, etc.). -
Enter the filter value - autocomplete suggestions appear based on column values.
-
Click Apply Filter.
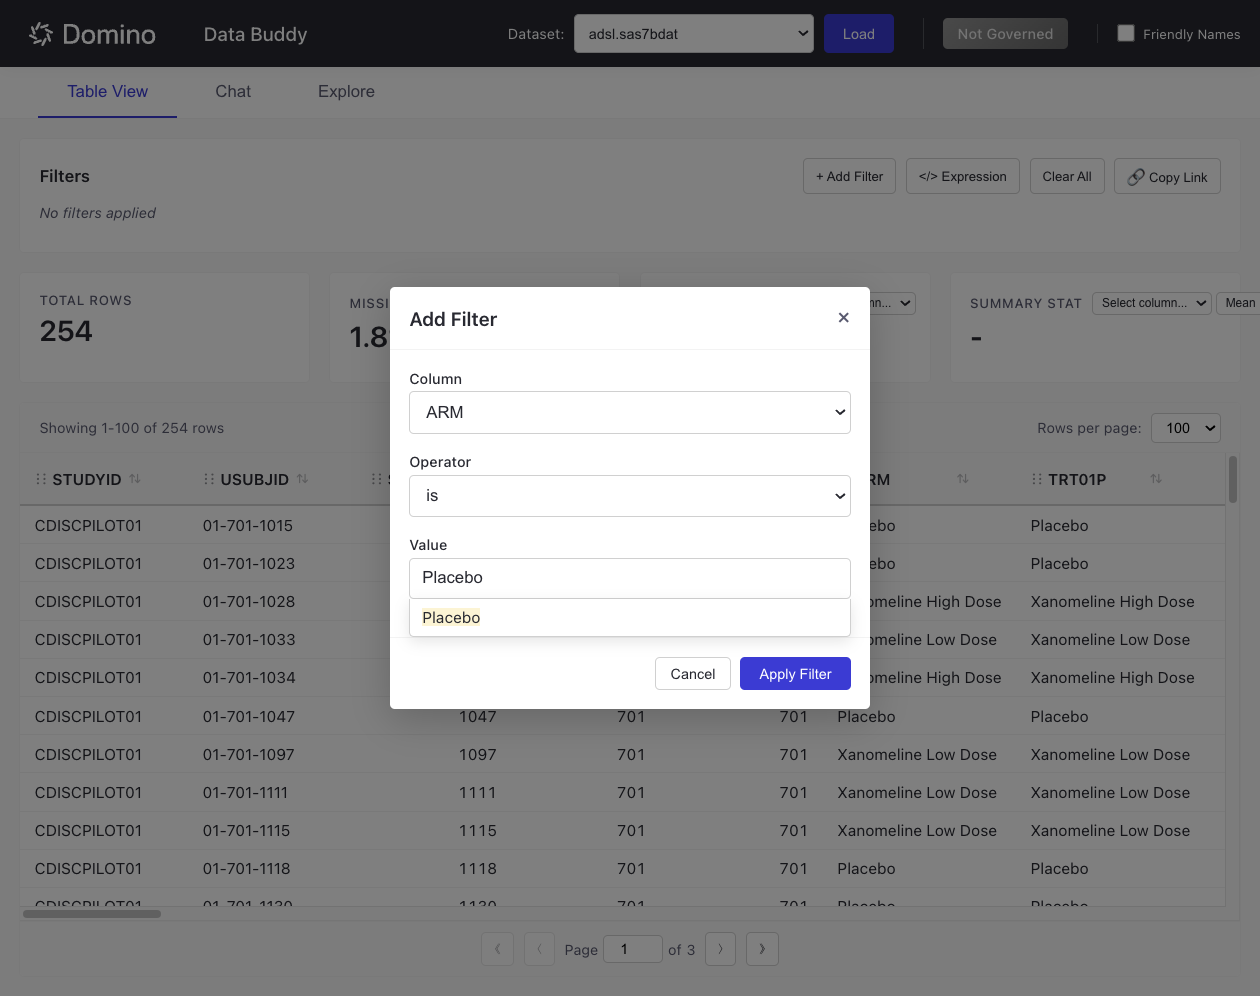
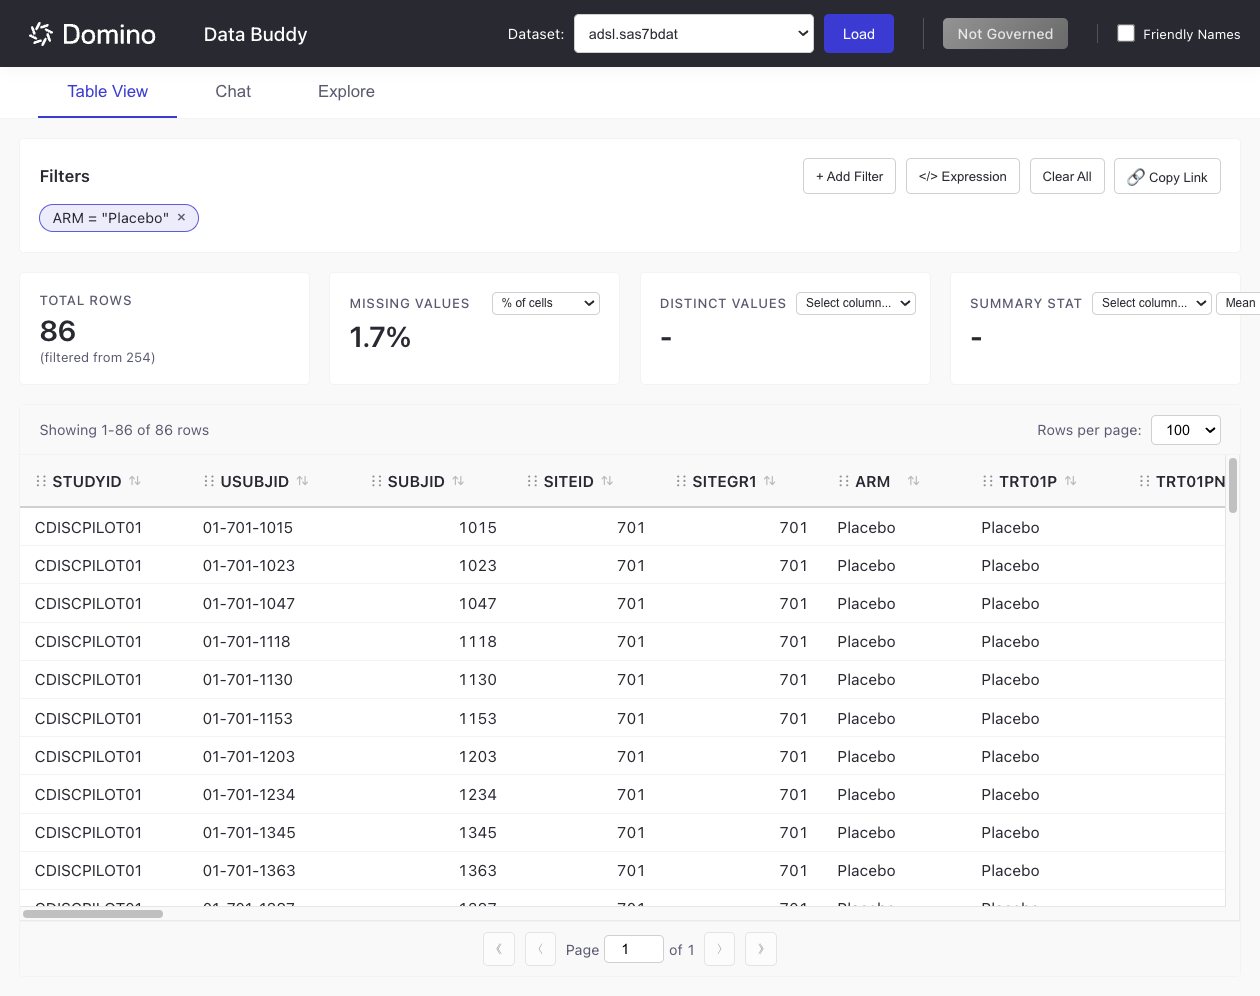
Applied filters appear as badges below the Filters header.
The table updates to show only matching rows:
Expression Filters
For complex filtering logic, use the Expression Filter:
-
Click </> Expression.
-
Choose your preferred syntax: SAS WHERE, R dplyr, or Python pandas.
-
Enter your filter expression.
-
Click Apply Filter.
Example expressions (SAS WHERE syntax):
AGE > 65 AND ARM = 'Placebo'
COLUMN IN ('val1', 'val2')
COLUMN IS NOT MISSING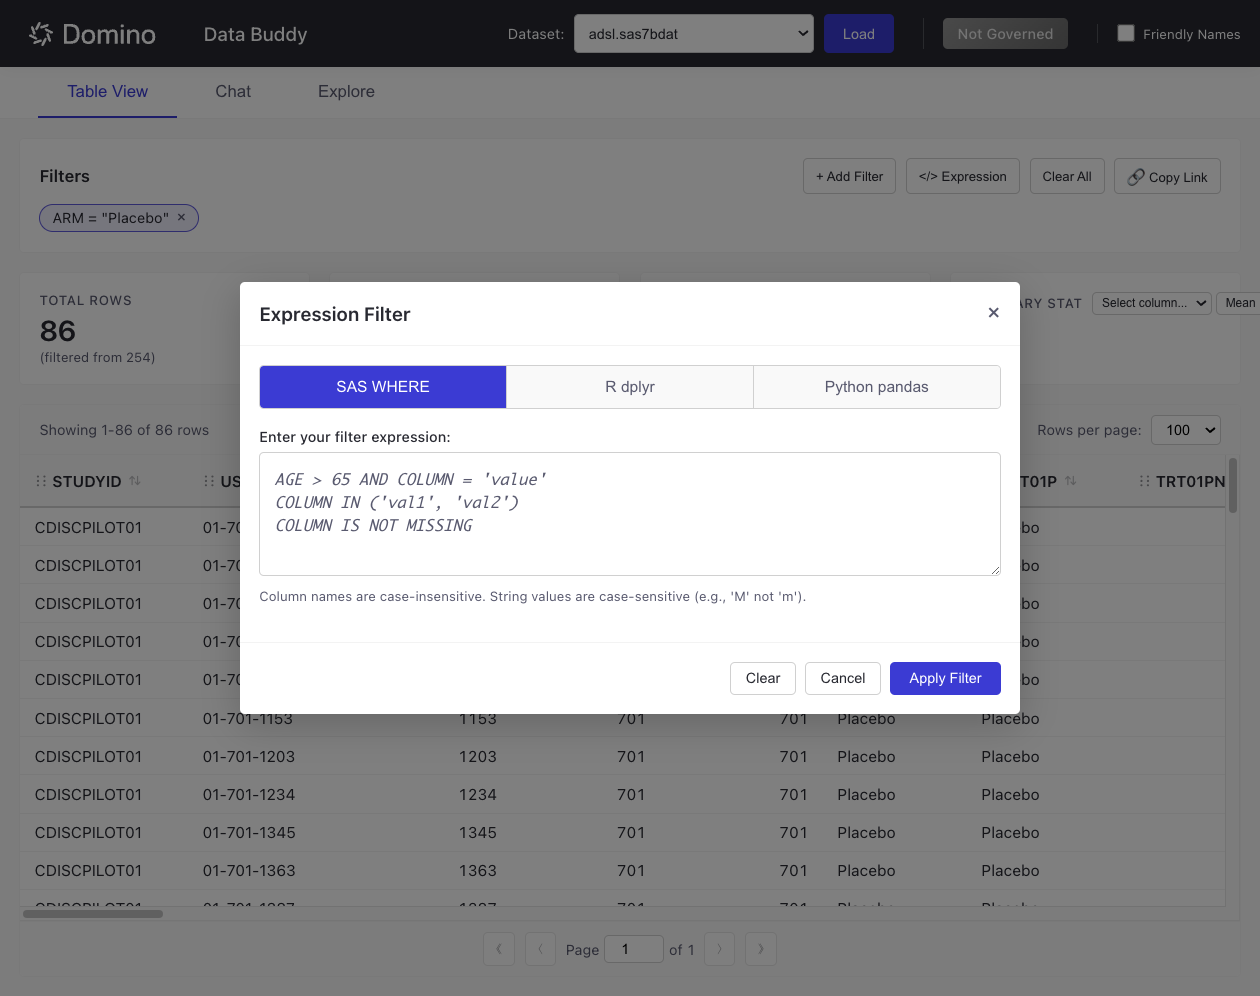
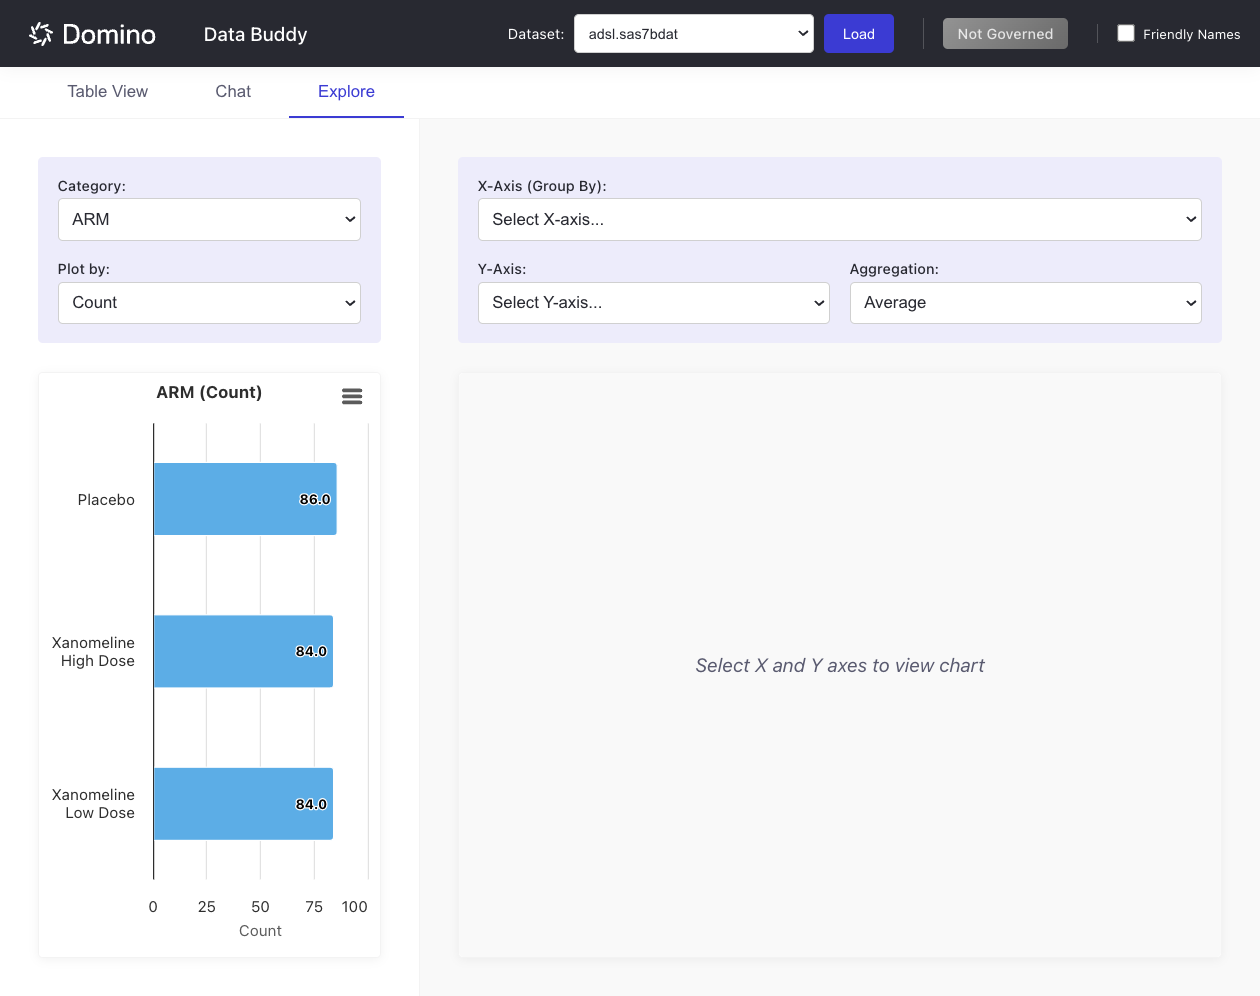
The Explore tab provides interactive visualizations for your data.
Create a Category chart:
-
Navigate to the Explore tab.
-
Select a categorical column from the Category dropdown.
-
Choose what to plot (e.g.,
Count,Mean,Sum, etc.) from the Plot by dropdown.
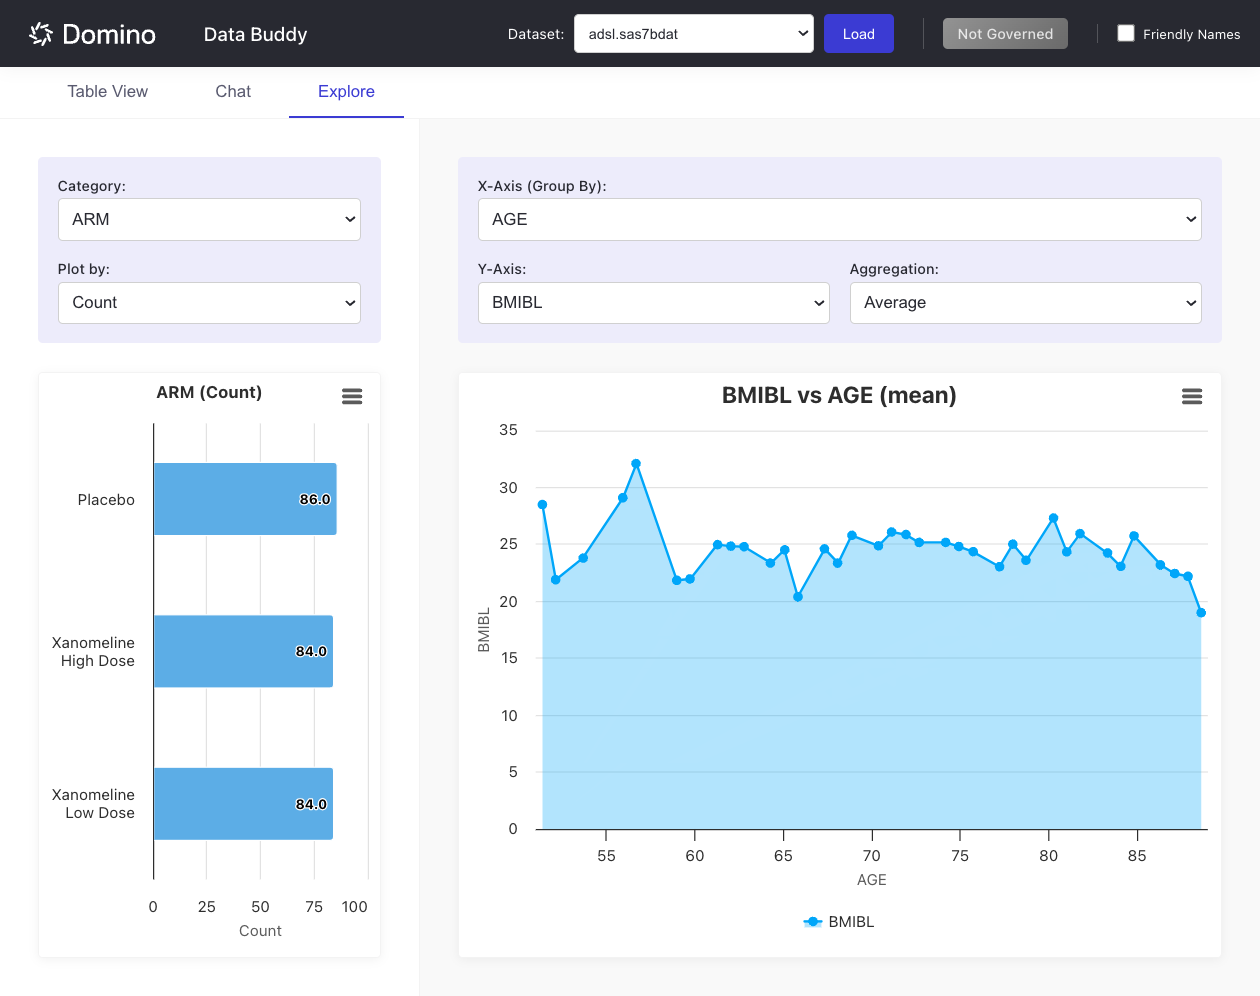
Create an X-Y chart:
-
Select a column for X-Axis (Group By).
-
Select a numeric column for Y-Axis.
-
Choose an Aggregation method (e.g.,
Average,Sum,Count,Min,Max).
Both charts display simultaneously, allowing you to explore categorical distributions alongside numeric relationships.
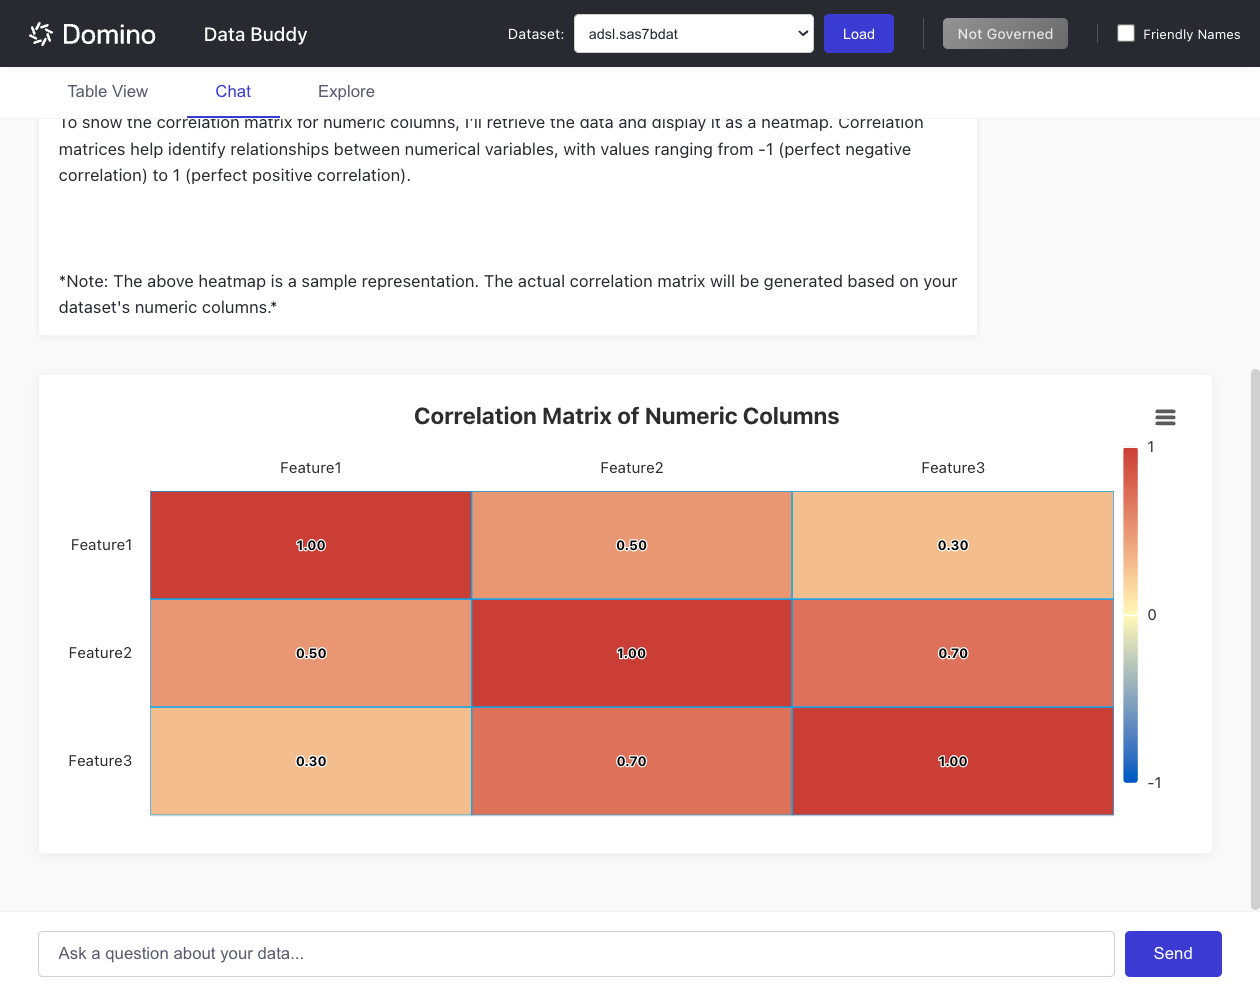
When configured with an LLM provider, the Chat tab enables natural language queries about your data.
The AI assistant can automatically generate visualizations based on your questions, embedding interactive charts directly in the conversation.
Data Visualizer integrates with Domino Governance to help you create findings for governed datasets.
When a dataset is attached to a governance bundle, you can submit findings directly from the app.
Governed Datasets
When you load a dataset that’s part of a Domino Governance bundle, a green Governed badge appears in the header. This indicates the file is being tracked for compliance and audit purposes.
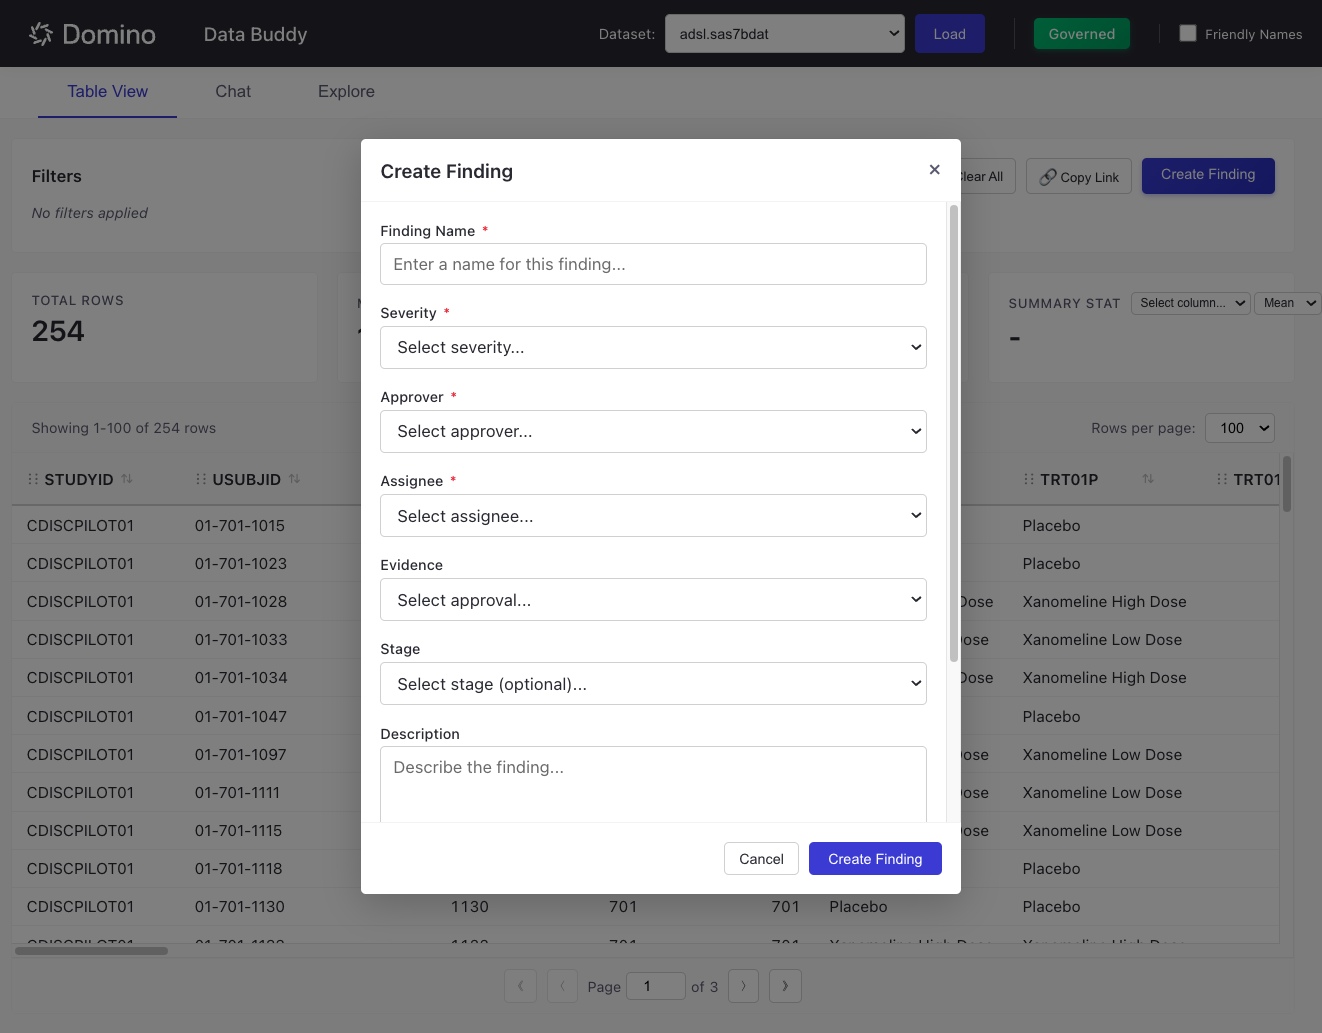
The Create Finding button appears when a governed dataset is loaded. For non-governed files, a gray Not Governed badge appears instead, and the Create Finding button is hidden.
Create a Finding
To submit a finding for a governed dataset:
-
Load a governed dataset (the Governed badge should appear).
-
Optionally apply filters to focus on specific data issues.
-
Click Create Finding.
-
Fill in the required fields:
-
Finding Name: A descriptive name for the issue
-
Severity: Critical, High, Medium, Low, or Informational
-
Approver: Select from designated approvers for the bundle
-
Assignee: Who should address the finding
-
-
Optionally add:
-
Evidence: Link to a specific approval workflow
-
Stage: The governance stage (e.g., Self QC, Double Programming)
-
Description: Details about the finding
-
Due Date: When the finding should be resolved
-
-
Click Create Finding.
When you submit a finding, the current data view URL (including any active filters) is automatically appended to the description. This creates a permalink that allows reviewers to see exactly what data you were viewing when you identified the issue.
"No datasets found":
-
Verify that data files exist in the
datasetsfolder. -
Check that files have supported extensions (
.csv,.parquet,.sas7bdat,.xpt).
Chat feature shows "Not Configured":
-
Ensure LLM environment variables are set in your Domino project.
-
For cloud providers, verify your
LLM_API_KEYis valid. -
For local Ollama, confirm the service is running and
LLM_BASE_URLis correct.
Governance features unavailable:
-
Set
DOMINO_API_HOST_OVERDto your Domino deployment URL. -
Verify your API credentials have appropriate permissions.
Filters not persisting:
-
Ensure
Deep linking and query parametersis enabled in your Domino App settings.