Instrument your agentic system to capture traces during execution. Tracing records every call your system makes, including downstream calls from agents and tools, so you can evaluate performance and debug issues.
To develop an agentic system in Domino:
-
Instrument your evaluation script with tracing, evaluation, and configuration.
-
Write your evaluation function to score agent responses.
-
Run as a Domino Job to create an experiment run.
|
Note
| As of Domino 6.2, the agent instrumentation SDK is included as part of the Domino Standard Environment. |
Your evaluation script is the file you’ll run as a Domino Job to test your agent against sample data. It needs three things:
-
The
@add_tracingdecorator on the function that calls your agent. -
A
DominoRunwrapper that groups traces into an experiment run with your agent config. -
An evaluator function that scores each response.
Domino auto-instruments all MLflow-supported frameworks. You can pass your framework to autolog_frameworks. Supported values include langchain, pydantic_ai, openai, anthropic*, llama_index, and others.
*Note that anthropic may not be supported fully by auto tracing and could require manual span instrumentation. However, you can easily use anthropic models from other agent frameworks.
If auto-tracing doesn’t capture all the steps you need, the Advanced: Manual span instrumentation section below has more details.
Here’s the structure of a complete evaluation script:
import csv
from domino.agents.tracing import add_tracing
from domino.agents.logging import DominoRun
from your_agent import create_agent
from your_evaluation_library import AgentEvaluator

config_path = "ai_system_config.yaml"


@add_tracing(
    name="single_question_agent",
    autolog_frameworks=["pydantic_ai"],
    evaluator=judge_single_question     # explained in Step 2
)
def process_single_question(data_point):
    agent = create_agent()
    result = agent.run_sync(data_point['question'])
    return {"answer": result.output}


def main():
    with DominoRun(agent_config_path=config_path) as run:
        with open("sample_questions.csv") as f:
            for row in csv.DictReader(f):
process_single_question(row)-
@add_tracingcaptures every call your agent makes, including downstream LLM calls, tool invocations, and retrieval steps, as a structured trace. -
The
evaluatorparameter attaches a scoring function that runs automatically after each invocation. We’ll define that in Step 2. -
DominoRungroups all traces into a single experiment run and logs youragent_config_pathYAML as parameters in the Experiment Manager. This lets you track exactly which model, prompts, and settings produced each set of results.
Aggregated metrics (optional)
Pass aggregated_metrics to automatically compute summary statistics across all traces in the run:
metrics = [("toxicity_score", "mean"), ("relevancy_score", "median")]

with DominoRun(agent_config_path=config_path, aggregated_metrics=metrics) as run:
    ...
Available aggregation types: mean, median, stdev, min, max. If omitted, Domino automatically logs the mean of every metric.
The evaluator function is called after each invocation of the traced function.
-
It receives the completed span, from which you read
.inputs(what was passed to your function) and.outputs(what it returned). -
It returns a dictionary of metric names to numeric values. These become the evaluation scores on that trace.
def judge_single_question(span):
    inputs = span.inputs
    output = span.outputs

    question = inputs['data_point']['question']
    answer = output['answer']

    evaluator = AgentEvaluator()
    result = evaluator.evaluate_response(query=question, agent_output=answer)

    return {
        "toxicity_score": result.toxicity_score,
        "relevancy_score": result.relevancy_score,
        "accuracy_score": result.accuracy_score,
        "overall_score": result.overall_score,
    }
The returned dictionary is attached to the trace and visible in the Domino UI. You can use any metric names and any number of metrics.
|
Note
|
The AgentEvaluator class in the example above is your own code. Domino does not prescribe a specific evaluation approach. Your evaluation library can use LLM-as-judge scoring, deterministic heuristics, embedding similarity, external APIs, or any combination. The simple_domino_agent repository has an example evaluation library to use as a starting point.
|
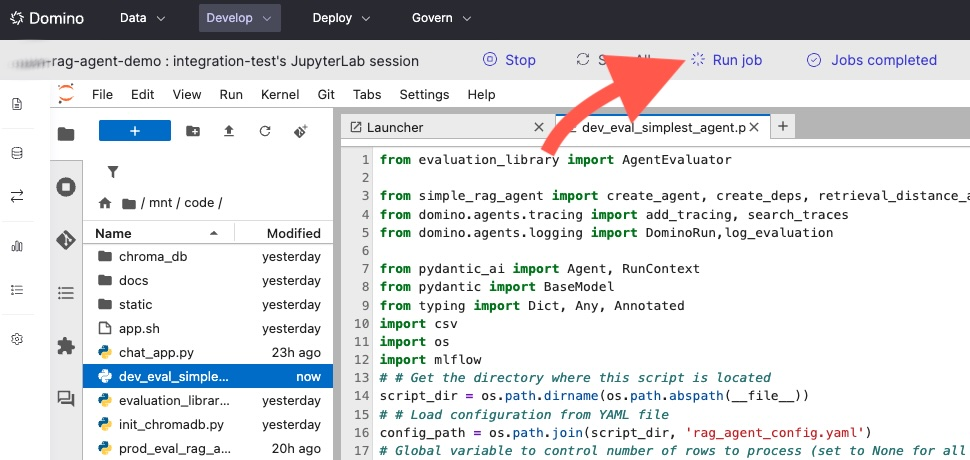
Run your evaluation script as a Domino Job. Running as a Job is what keeps lineage intact. Domino ties the experiment run to a specific code commit, YAML agent config, all traces, and aggregated evaluation results. Only Job-originated runs can be deployed to production.
|
Tip
| You can run your evaluation script from a workspace to gut-check results while developing. To preserve full lineage and enable deployment from the run, run it as a Job. After pushing your file changes, you can kick off a Job directly from your workspace. |
-
Click the Run job button:
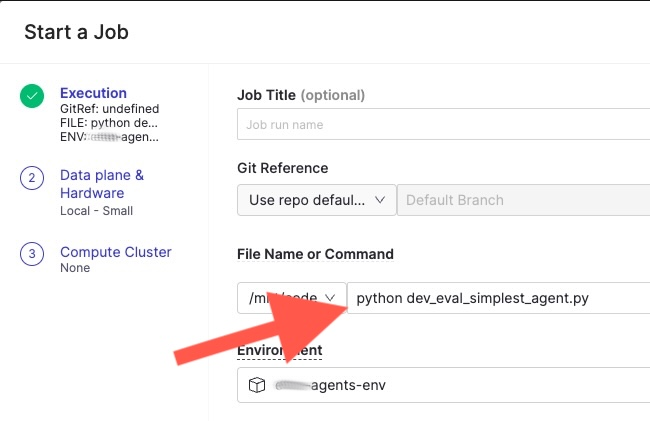
-
A window opens where you can specify the script to run and the hardware tier. Select your evaluation script and confirm to launch the Job:
-
Your agent will run against a dataset of sample queries that you maintain alongside your code. Each query produces a separate trace with its own evaluation scores. Together, these traces form a complete picture of how this agent configuration performs. As you iterate on prompts, models, or tools, re-run the same dataset to compare results.
A typical sample dataset is a CSV with questions and categories. Note that some off-topic questions are intentionally included to fully test the evaluator. For example:
question_id,question,category
1,What is the standard deduction for 2023?,deductions
2,When is the tax filing deadline?,deadlines
3,What is the distance of Andromeda from the Milky Way?,space
4,Do I need to pay taxes on unemployment benefits?,income
5,What is the child tax credit amount?,credits
...
Your evaluation script loops over this dataset inside
DominoRun. Each call to the traced function generates one trace with evaluation scores attached:with DominoRun(agent_config_path=config_path) as run: with open("sample_questions.csv") as f: for row in csv.DictReader(f): process_single_question(row) # one trace per question -
When the Job finishes, the Experiment Manager shows this run with all its traces, one per sample question, each with the evaluation scores your judge function returned. Aggregated metrics, such as mean toxicity and mean relevancy, are computed across all traces so you can compare this agent version against others at a glance.
-
After the Job completed, you can:
-
View traces in the Agent Traces tab in your project.
-
View the experiment run in the Experiments tab.
-
Compare runs across different agent configurations in the Experiment Manager.
-
Deploy an agent directly from any experiment run that originated from a Job.
-
The simple_domino_agent repository has a complete working example, including dev_eval_simplest_agent.py and sample_questions.csv.
The auto-tracing integrations listed above cover the most common frameworks. In some cases your agent may include steps that auto-tracing doesn’t capture, such as custom tool calls, non-framework LLM API calls, or internal processing functions. For these, you can manually instrument spans using MLflow’s @mlflow.trace decorator.
Manual spans work alongside auto-traced spans. Combine @add_tracing on your top-level function with @mlflow.trace on inner functions to get typed spans with structured metadata:
import mlflow
from domino.agents.tracing import add_tracing

@mlflow.trace(span_type="TOOL", name="fetch_weather")
def fetch_weather(city):
    """This function will appear as a TOOL span in the trace."""
    return call_weather_api(city)

@mlflow.trace(span_type="LLM", name="custom_llm_call")
def call_custom_model(prompt):
    """This function will appear as an LLM span in the trace."""
    return requests.post(my_endpoint, json={"prompt": prompt}).json()

@add_tracing(name="my_agent", autolog_frameworks=["openai"])
def run_agent(question):
    weather = fetch_weather("NYC")       # manually traced as TOOL
    result = call_custom_model(question)  # manually traced as LLM
    return result
Available span types include LLM, TOOL, RETRIEVER, CHAIN, AGENT, and EMBEDDING. Typed spans enable filtering and specialized rendering in the Trace Explorer.
The MLflow Manual Tracing documentation has full details on manual tracing.
|
Note
|
The Domino SDK is actively adding native support for span types in the @add_tracing decorator. Once available, you’ll be able to assign span types directly without dropping down to the MLflow API. This section will be updated when that capability ships.
|
-
Experiment Manager: Compare runs, view traces, and deploy to production.
-
Set up LLM access: Configure your LLM endpoints (external providers or Domino-hosted).
-
Python SDK for agents: A full API reference for
@add_tracing,DominoRun, and trace search.