The following sections describe the basic troubleshooting steps and useful tools that cover the overall Domino platform health.
Deploy the Domino Admin toolkit if you have not already.
Use the Admin toolkit to run a health check and observe the overall system status.
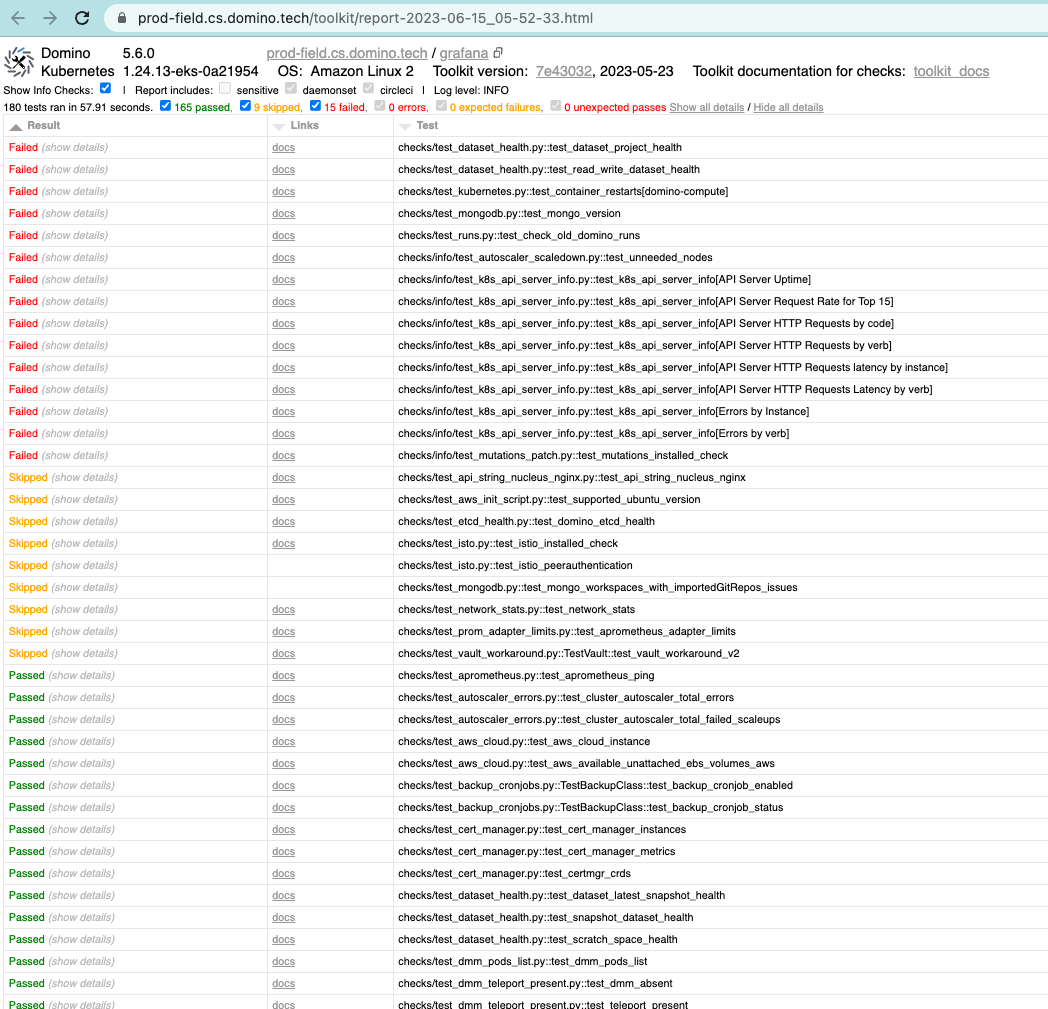
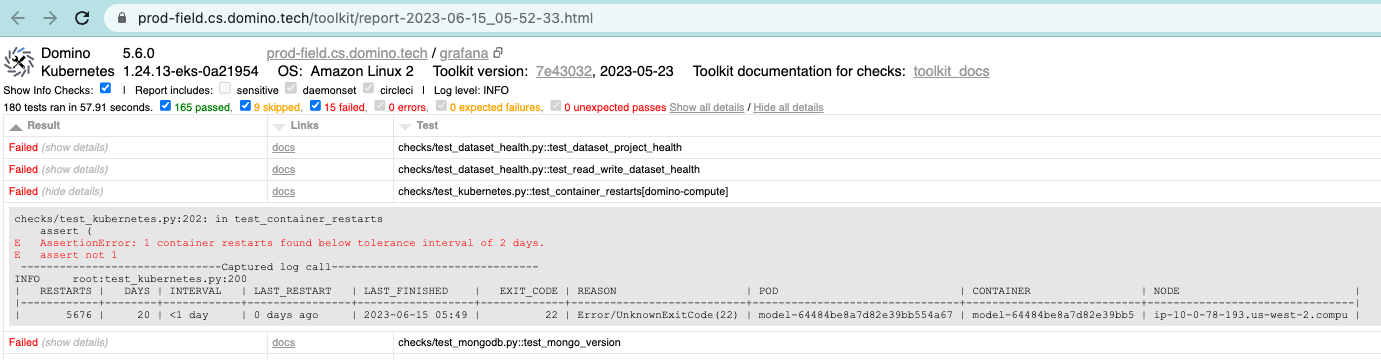
Expand each failed section to get more information.
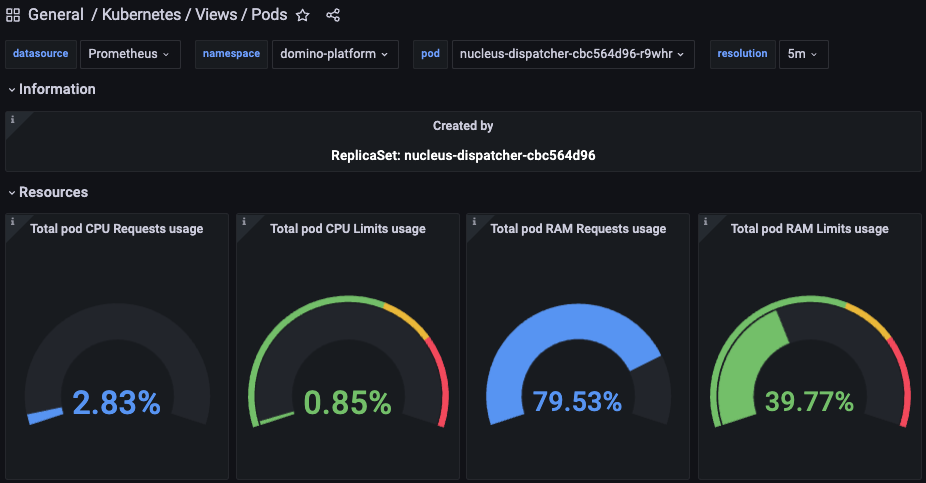
Domino Grafana dashboards provide various metric visualizations around Domino services.
For production deployments, a Grafana instance is deployed and externally accessible at <domino url>/grafana. The default username is grafana and the password is stored in the cluster.
<user-id>$ kubectl get secret -n domino-platform grafana -ojsonpath=
'{.data.admin-password}'| base64 -d; echo
There are preconfigured dashboards that are readily available for review during troubleshooting. Below is an example of the Nucleus dispatcher’s health.
Check if there are any pods that are not in Active or Completed status, as this is the starting place to look at potential issues.
<user-id>$ ~ % kubectl get pods -A | egrep -v "(Running|Completed)"
NAMESPACE         NAME                                                         READY   STATUS             RESTARTS           AGE
domino-compute    model-64484be8a7d82e39bb554a67-65fb5f9c48-7hlgd              3/4     CrashLoopBackOff   5547 (3m43s ago)   19d
tigera-operator   tigera-operator-657cc89589-k7tp5                             0/1     CrashLoopBackOff   5241 (2m1s ago)    19d
Keep an eye on the RESTARTS column. If there are many restarts of a certain pod, that pod is having issues. Describing the pods should give you more information as to why they are not in the running state or frequently restart.
Kubernetes events usually provide underlying issues behind the user experience. Look for related events in domino-platform and domino-compute namespaces sorted by time stamp.
<user-id>$ ~ % kubectl get events --sort-by='.metadata.creationTimestamp' -n domino-platform
LAST SEEN   TYPE      REASON             OBJECT                                          MESSAGE
53m         Warning   Unhealthy          pod/zookeeper-2                                 Liveness probe failed:
52m         Normal    Scheduled          pod/kuberhealthy-frontend-liveness-1686765147   Successfully assigned domino-platform/kuberhealthy-frontend-liveness-1686765147 to ip-10-0-124-141.us-west-2.compute.internal
52m         Normal    Created            pod/kuberhealthy-frontend-liveness-1686765147   Created container kuberhealthy-frontend-liveness
52m         Normal    Pulled             pod/kuberhealthy-frontend-liveness-1686765147   Container image "quay.io/domino/kuberhealthy.http-check:latest-358998" already present on machine
52m         Normal    Started            pod/kuberhealthy-frontend-liveness-1686765147   Started container kuberhealthy-frontend-liveness
45m         Normal    SuccessfulCreate   job/dmm-parquet-conversion-job-28112760         Created pod: dmm-parquet-conversion-job-28112760-k4ptr
45m         Normal    SuccessfulCreate   cronjob/dmm-parquet-conversion-job              Created job dmm-parquet-conversion-job-28112760
45m Normal Scheduled pod/dmm-parquet-conversion-job-28112760-k4ptr Successfully assigned domino-platform/dmm-parquet-conversion-job-28112760-k4ptr to ip-10-0-124-141.us-west-2.compute.internalSometimes pods can exceed the CPU and memory limits imposed by the default Kubernetes configuration.
<user-id>$ kubectl top pods -n domino-platform --sort-by=cpu
NAME                                                         CPU(cores)   MEMORY(bytes)
docker-registry-0                                            259m         37Mi
fleetcommand-reporter-64fbb8cb6b-bcdxs                       184m         12Mi
rabbitmq-ha-311-2                                            163m         216Mi
prometheus-server-0                                          105m         1763Mi
rabbitmq-ha-311-1                                            96m          193Mi
rabbitmq-ha-311-0                                            93m          179Mi
mongodb-replicaset-1                                         80m          744Mi
mongodb-replicaset-0                                         71m          910Mi
mongodb-replicaset-2                                         71m          783Mi
newrelic-infrastructure-monitor-services-68c5c66c-fqqnm      55m          65Mi
nucleus-frontend-7749b69687-d6sh4                            48m          7929Mi
nucleus-frontend-7749b69687-8kwhz                            45m          7853Mi
newrelic-infrastructure-d4g8f                                40m          29Mi
dmm-redis-ha-server-0                                        35m          16Mi
nucleus-dispatcher-56cb5884b7-b5sgp                          34m          6185Mi
redis-ha-server-0                                            29m          1123Mi
mongodb-primary-0                                            28m          262Mi
mongodb-secondary-0                                          26m          259Mi
The following shows the CPU and memory usage of the current nodes.
<user-id>$ prod-field % kubectl top node
NAME                                            CPU(cores)   CPU%   MEMORY(bytes)   MEMORY%
ip-10-0-101-39.us-west-2.compute.internal       103m         1%     1600Mi          5%
ip-10-0-118-253.us-west-2.compute.internal      291m         3%     9306Mi          30%
ip-10-0-124-141.us-west-2.compute.internal      421m         5%     12506Mi         40%
ip-10-0-33-46.us-west-2.compute.internal        125m         1%     5670Mi          18%
ip-100-164-53-223.us-west-2.compute.internal    1212m        30%    2935Mi          19%
$ prod-field % kubectl top node -l dominodatalab.com/node-pool=platform
NAME                                         CPU(cores)   CPU%   MEMORY(bytes)   MEMORY%
ip-10-0-118-253.us-west-2.compute.internal   374m         4%     9308Mi          30%
ip-10-0-124-141.us-west-2.compute.internal   380m         4%     12484Mi         40%
ip-10-0-34-218.us-west-2.compute.internal 338m 4% 6127Mi 20%The following sections provide useful steps to troubleshoot: