The Domino FinOps dashboard offers a comprehensive view and detailed breakdown of various expenses you might incur. There are a few steps to follow to get it configured for your teams before you can launch it and tour the dashboard.
Login with SysAdmin credentials to set up this dashboard for your teams.
Step 2: Fetch and upload files
Once your project has been created to host the dashboard app, follow these steps to publish it:
-
Download the following three files from the cost-dashboard-dash repository:
-
requirements.txt -
app.sh -
dash-cost-dashboard.py
-
-
In Domino, go to the Code section by clicking in the project’s sidebar.
-
Drag and drop the three files into your project.
-
Verify that the files uploaded successfully.
Step 3: Create and publish the app
After you have created a new project and uploaded the files, you’ll need to create and publish the app:
-
Navigate to the App section in the sidebar of the Project menu.
-
Fill in the following required fields:
-
Title: add a title for the app that is easily identifiable.
-
Environment: choose an environment from the menu. The Domino standard environment is fine for this.
-
Hardware Tier: choose a hardware tier from the menu. A smaller hardware tier is enough to run the app.
-
-
Click Publish. After publishing, you’ll be redirected to the App Status page.
-
Wait until the App status changes from Pending to Running.
Step 4: Verify app status and launch dashboard
You can check the app’s user output to verify that it is properly set up.
-
From the App Status page, click View Execution Details.
-
Click User Output to view a log showing the environment setup.
-
Your app is ready once
Running on http://127.0.0.1:8888appears towards the bottom of the User Output log. -
Launch the dashboard by clicking Start > View App.
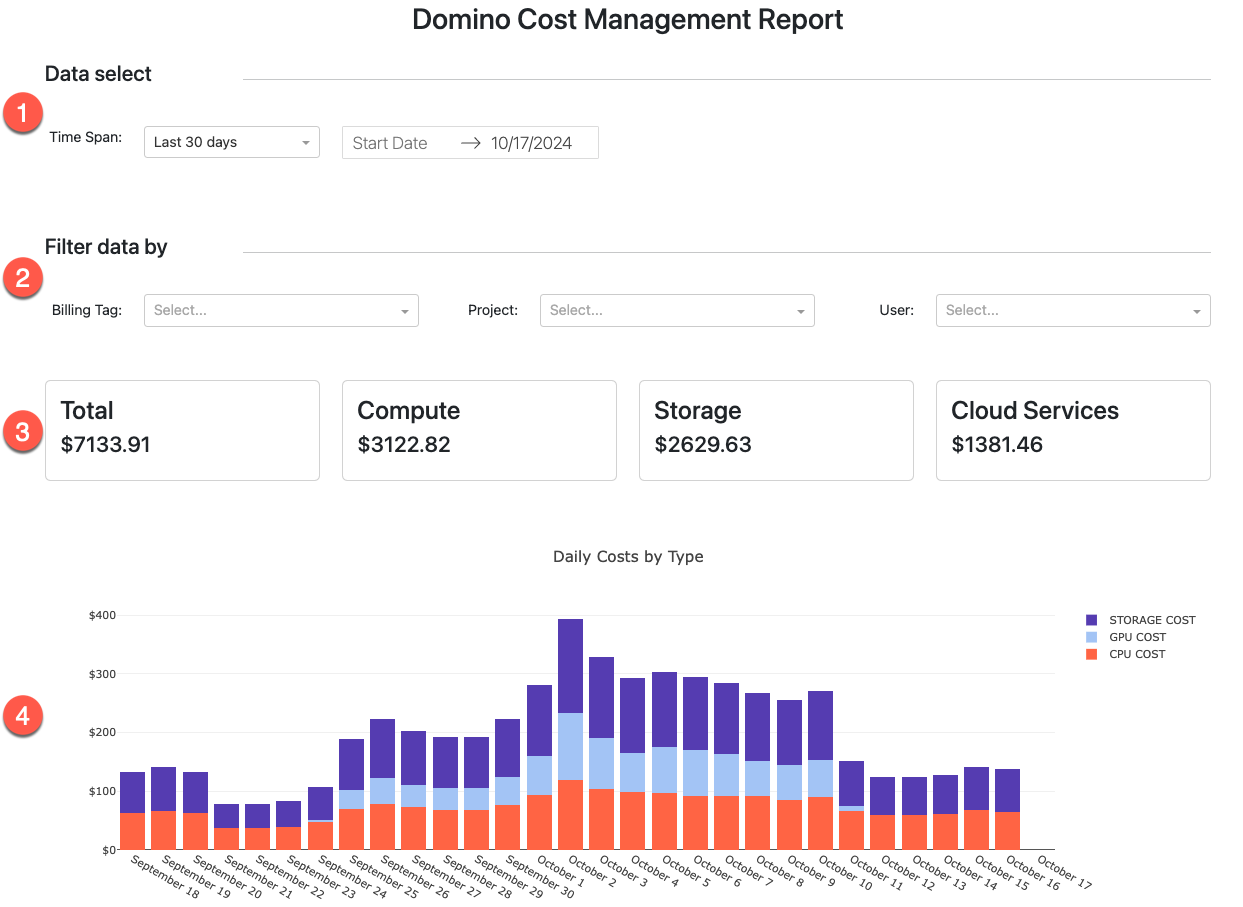
Domino FinOps comes with a default cost reporting dashboard to help you identify key drivers of your infrastructure usage. You can track spending on things like data preparation jobs, model training, deployed Domino endpoints, and more. Here is a quick tour of the Domino FinOps window:

-
Data select - Time Span: Choose this to specify a time span for your report.
-
Filter data by: Filter by a specific Billing Tab, Project, or User.
-
Total-Compute-Storage: Shows costs for compute, storage, and the total cost.
-
Daily Costs by Type: Bar charts showing either the total daily costs or based on selected filters.
Here are other ways to use Domino FinOps:
-
Automatic allocation of usage-based costs to projects, organizations, users, billing tags, and cost centers.
-
Optimization of dataset storage usage to reduce cloud storage costs.
-
Prevention of overspending by setting budgets and sending alerts to stakeholders, administrators, and team members approaching their limits.
-
Generation of chargeback/showback reports, using APIs to facilitate cost recovery across organizations, and engaging with high-expenditure users to optimize infrastructure usage.
